USDC Shows Why Stablecoin Risk Analysis Is Not One Signal
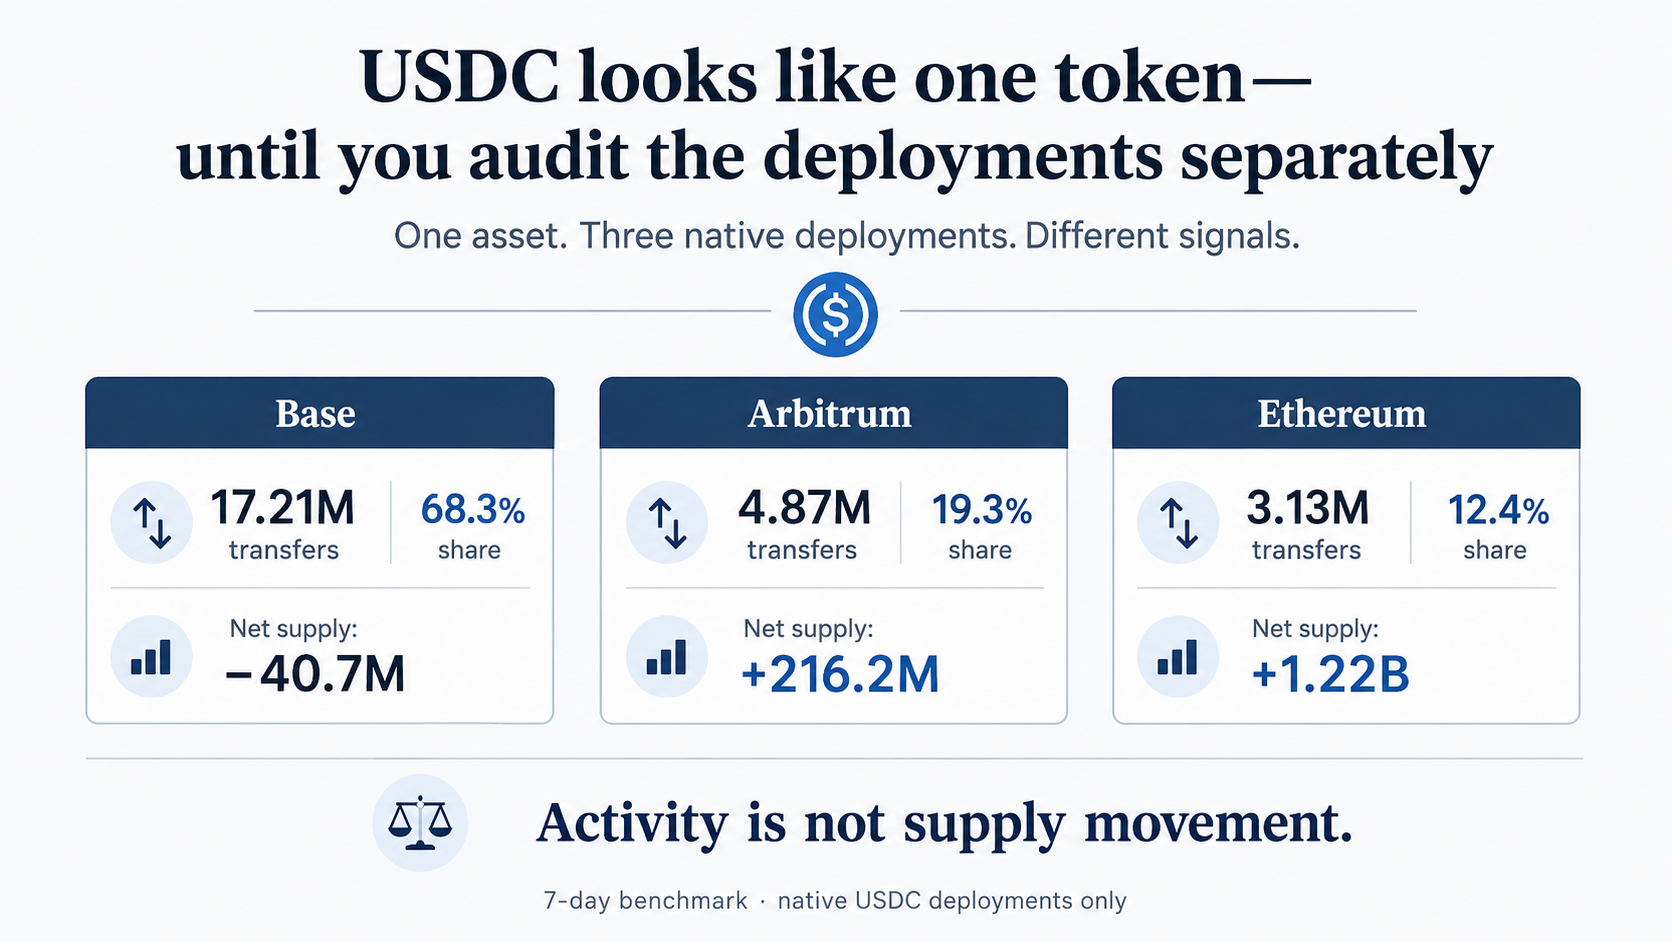
Base led transfer activity. Ethereum led net supply expansion. Same week, different risk signals.
The metric cracks before the narrative
In a wallet, USDC reads as one balance. On-chain it is several native deployments—each with its own Transfer history, mint/burn trail, issuer controls, cross-chain plumbing, and liquidity context. Comparing chains means comparing chain-local observables, not folding them into a single slogan about “activity.”
For 2026-05-01 → 2026-05-08 UTC I ran a transfer audit on native USDC on Ethereum, Base, and Arbitrum. Base dominated decoded Transfer volume (68.3% of deduped events); Ethereum posted the largest deployment-local net mint/burn delta (+1,220.0M USDC) while Base sat at −40.7M USDC. Transfer count rewards volume—not net pressure. That is the divergence worth arguing about before any activity-based risk narrative.
I would not read the pairing as moral ranking (“where the money lives”). It is a clean stress test for any dashboard that conflates transfer count with issuance pressure without separating layer and counterparty.
Why dashboards need a floor first
Liquidity stress and peg deviation are common rhetorical anchors. Useful—but they skate over a narrower gate: whether boundary totalSupply and mint/burn logs reconstruct under fixed decode rules for each deployment.
A deployment can run hot on Transfer noise while ledger-level mint/burn net is negative; another can inflate supply with modest event share. Mislabel either column and the causal story attaches to the wrong mechanism. Evidence 2 below is descriptive for one reproducible benchmark, not a stability verdict for USDC as a franchise. Replication: stablecoin-audit.
Why USDC (for this benchmark)
Zero-address Transfer mint/burn plus boundary totalSupply gives a legible accounting layer. Multi-chain native deployments without pretending equivalent block semantics add cross-chain contrast. Enough traffic that “event share vs. mint/burn delta” is not a synthetic toy.
The analytical bet is auditability of the accounting layer first; cross-chain message matching, pool depth, and admin events are explicitly out of scope until that layer is stated.
Evidence 1: accounting floor passed
Before comparing activity to supply, the audit checks whether the accounting layer reconciles on each deployment.
For each chain and block window:
totalSupply(end) − totalSupply(start − 1) = mints − burns
Mints and burns follow the usual ERC-20 reading: a zero-address Transfer is mint (from 0x000…000) or burn (into 0x000…000). PASS means boundary totalSupply is explained by those events under fixed decode/dedup rules—not that reserves match or the peg is guaranteed.
Accounting floor check
| Chain | Transfers decoded | Duplicate logs | Supply invariant | Provenance stamped |
|---|---|---|---|---|
| Base | 17,208,596 | 0 | PASS | PASS |
| Arbitrum | 4,866,248 | 0 | PASS | PASS |
| Ethereum | 3,130,346 | 0 | PASS | PASS |
Metadata and historical totalSupply calls also passed on all three chains (qa_report.json in the benchmark bundle).
Interpretation: If this floor failed, the transfer-vs-supply exercise below would sit on broken reconciliation. It held, so the split is worth reading as a real signal separation—not dismissing it as a decode artifact.
Window (UTC-resolved blocks):
| Chain | from_block |
to_block |
Header start | Header end |
|---|---|---|---|---|
| Arbitrum | 458085624 | 460491249 | 2026-05-01T00:00:00Z | 2026-05-08T00:00:00Z |
| Base | 45402127 | 45704526 | 2026-05-01T00:00:01Z | 2026-05-07T23:59:59Z |
| Ethereum | 24996368 | 25046605 | 2026-05-01T00:00:11Z | 2026-05-07T23:59:59Z |
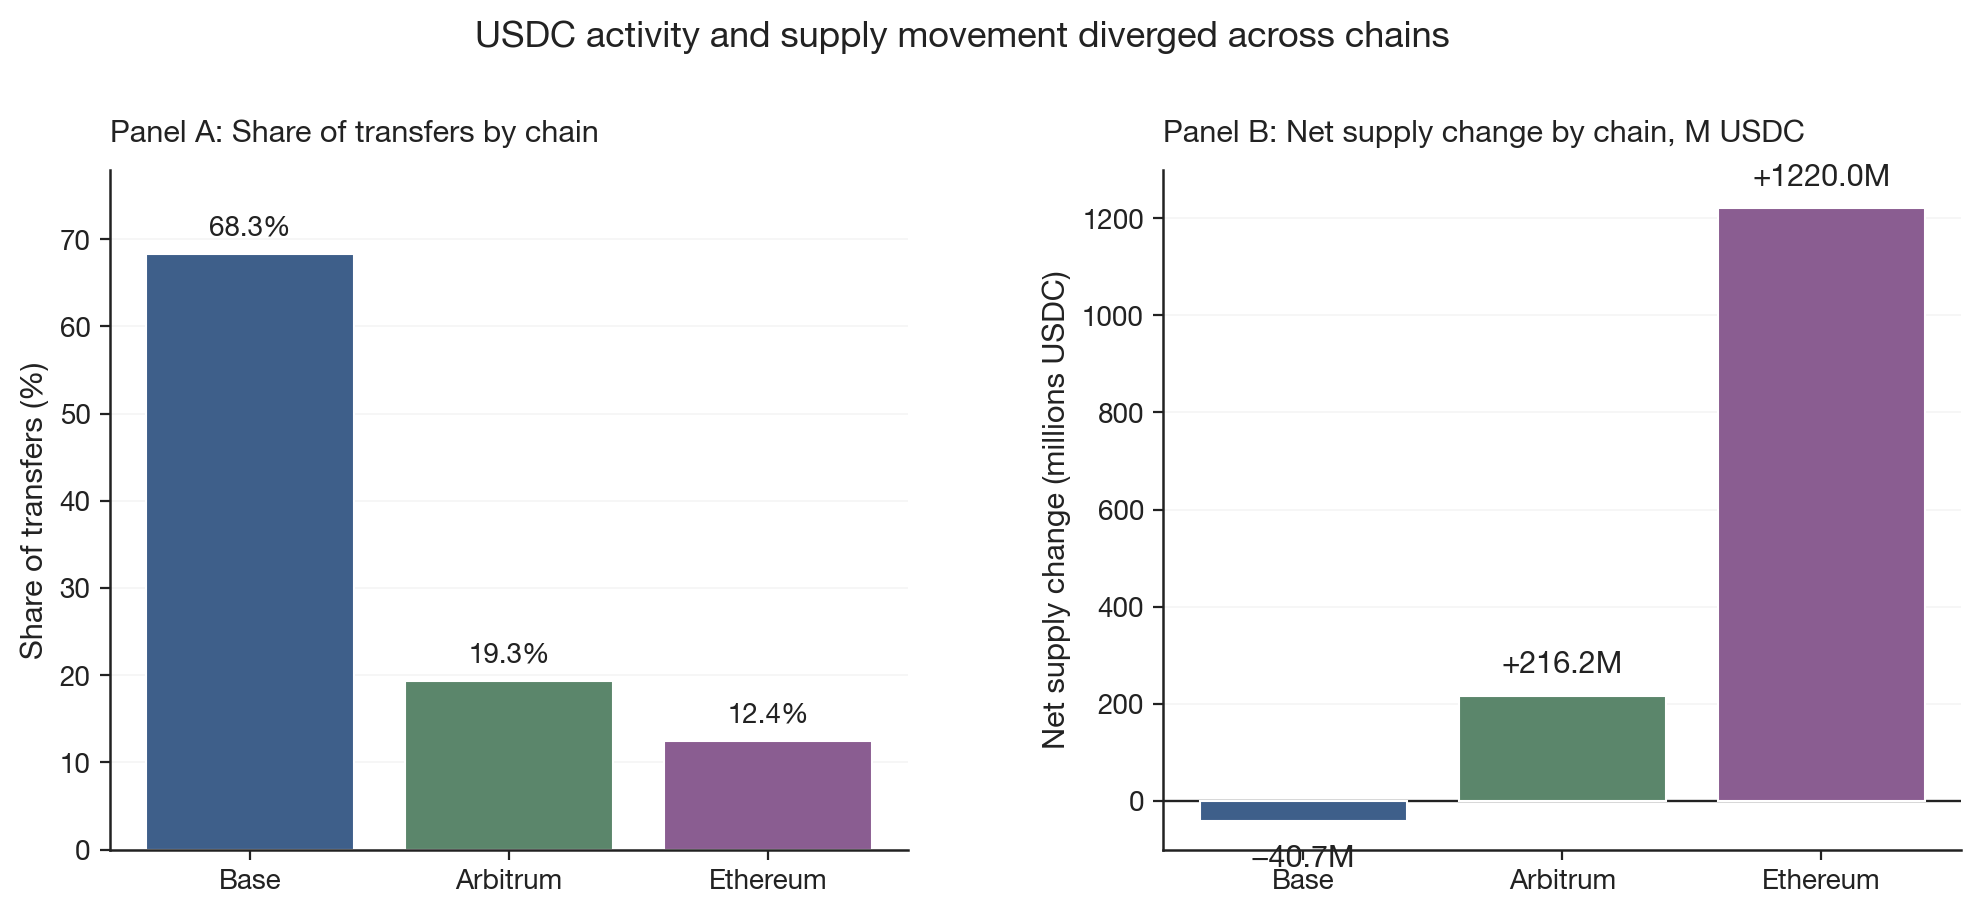
Evidence 2: activity and supply movement diverged
Definition (narrow): “Transfer activity” here is the decoded Transfer count: including wallet-to-wallet, router paths, programmatic rebalance loops, LP mint/burn that touches the asset, batching proxies, anything that emits the event under the audited decode window. It is not a retail-user census and not labeled as such.
Raw event counts are especially tricky across chains with different fee environments. On lower-fee chains, the same nominal activity can be split into more on-chain events, e.g., router paths, batching, programmatic loops. Without address classes or clustering, a transfer count mixes economic demand with execution mechanics. This run does not ship those tags; treat count-as-activity as guilty until partitioned.
What this may reflect (not verified in this slice): canonical CCTP burn-to-message plumbing would reconcile local burns with issuance elsewhere—Base’s negative net delta could be compatible with mechanisms such as CCTP-style outflow, but this run does not verify that route, because Evidence 3 marks cross-chain pairing as absent. Net supply change is mint/burn-implied at the ERC-20 boundary; it need not correlate with raw Transfer mass.
Activity vs. supply (7d window, native deployments)
| Chain | Share of transfers | Net supply change | Net supply change per 1,000 transfers |
|---|---|---|---|
| Base | 68.3% | −40.7M USDC | −2.4K USDC |
| Arbitrum | 19.3% | +216.2M USDC | +44.4K USDC |
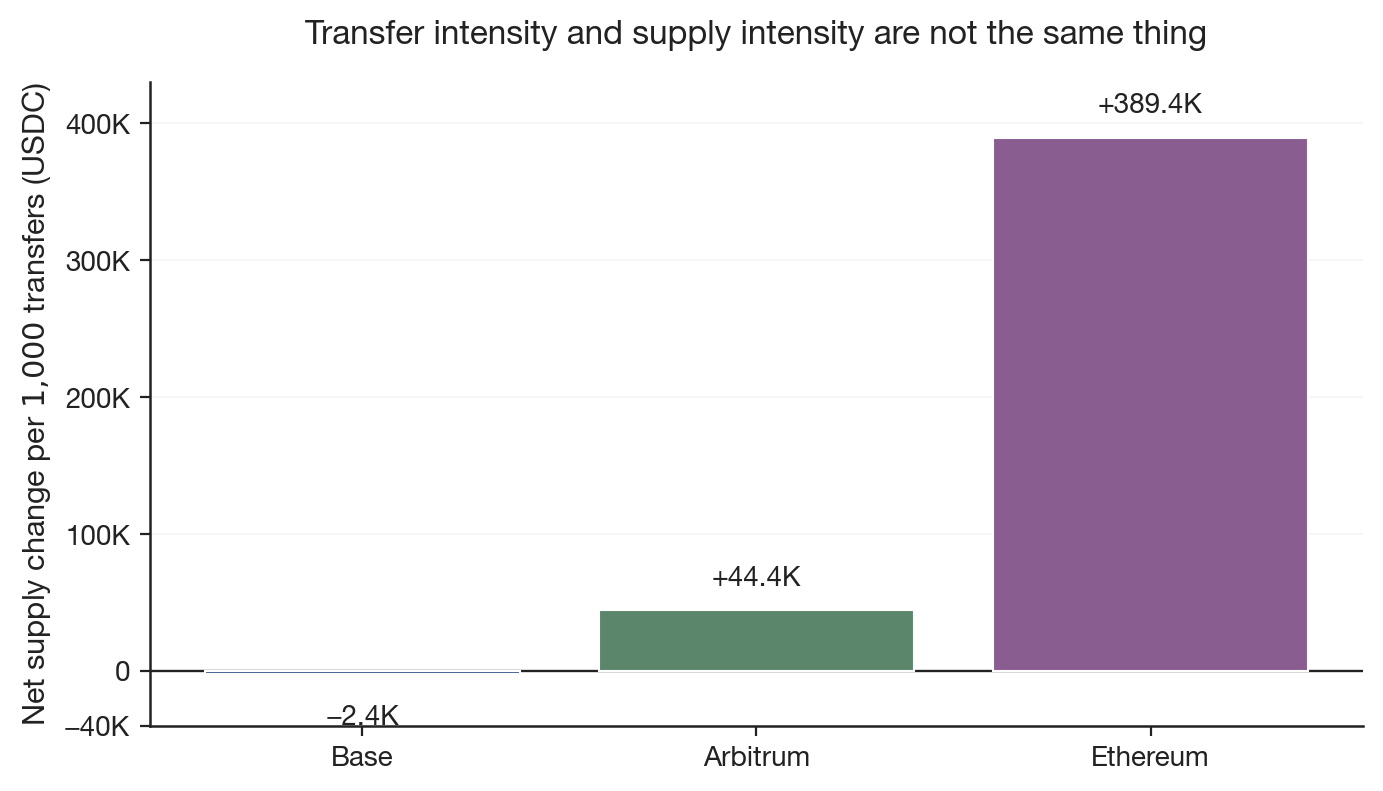
| Ethereum | 12.4% | +1,220.0M USDC | +389.4K USDC |
Note: Net supply is deployment-local (onchain_delta at 6 decimals). Shares use deduped transfer counts; three-chain total 25,205,190 events. Per-1k column = net supply change ÷ (transfers / 1,000).
Ethereum is lowest on chain-local transfer share but largest on net supply change per 1k events; Base is flipped on both. The juxtaposition survives normalization—meaning the tension is structural to the indicators, not a scale artifact within this aggregation. One window stays one window; the narrower claim is non-interchangeability of signals, not a forecast ranking.
supply_audit.csv scaled to M USDC (raw / 10¹²)—this does not infer reserve adequacy, liquidity, or safety.
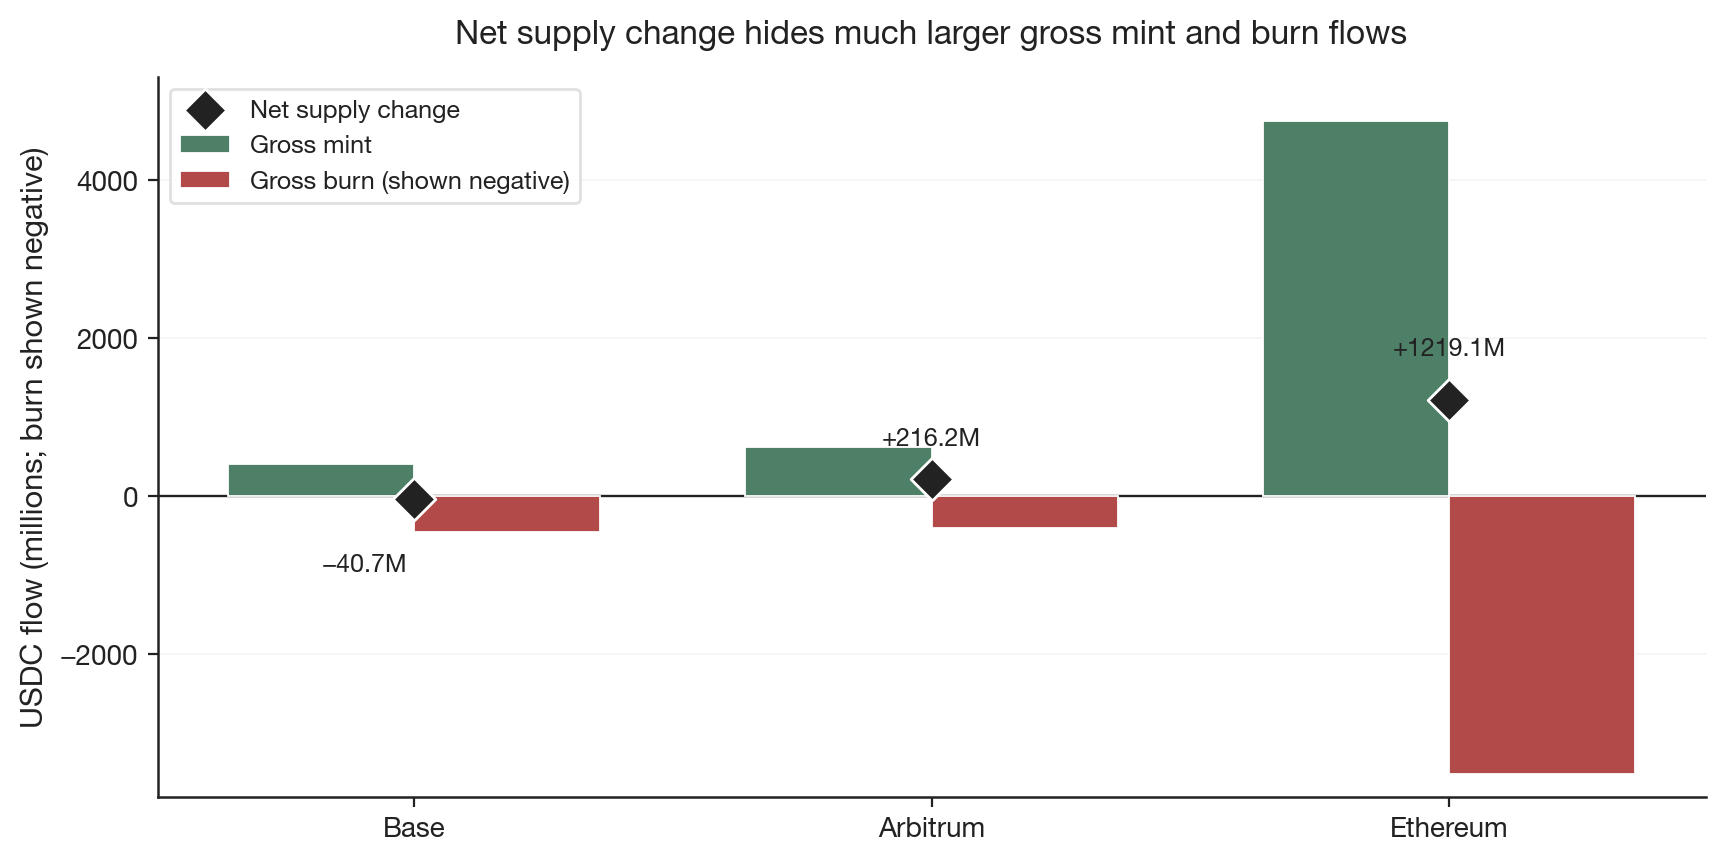
Gross churn vs. net (same CSV)
Mint and burn totals can sit large while deployment-local net stays small—that is churn, not hidden stability by itself. I use the ratio below as a diagnostic, not a ranking:
Gross-to-net ratio = (gross mints + gross burns in M USDC) / abs(net deployment delta in M USDC), using sums from supply_audit.csv scaled as raw / 10^12:
| Chain | Ratio (rounded) |
|---|---|
| Base | ~21× |
| Arbitrum | ~4.8× |
| Ethereum | ~6.8× |
Base’s net move is comparatively small beside its two-sided ledger flow; Ethereum’s net dominates numerically yet still sits modest relative to combined gross issuance and destruction paths. Arbitrum is not midpoint on this churn metric despite sitting between Ethereum and Base on transfer share—in this window it exhibits the lowest ratio of the trio, meaning net absorbs a conspicuous share of summed gross magnitude under this definition.
Interpretation: High ratio flags that net is a washed-out summary of offsetting corridors; analysts should insist on decomposition (issuer mints vs. canonical burn routes vs. local recycling) rather than extrapolating “healthy flow” from a single net diagonal.
Takeaway: transfer intensity ≠ ledger intensity
Transfer activity is a weak proxy for issuance pressure at the audited boundary. Per-1,000-transfer scaling reinforces the wedge; churn ratios add a second wedge between summed issuance/destruction ledger traffic and single-number net.
None of these rows is a liquidity readout or packaged risk score. They only show which evidence is missing for claims often made from dashboard metrics. Evidence 1 still comes first; if totals and logs drift, overlays inherit the leakage.
Evidence 3: risk layers require different data
Any serious risk map owes the reader falsifiable instrumentation per row, not just a list of possible concerns. The matrix is evidence availability for this codebase, not a shipping promise.
| Risk surface | Observable evidence | Covered in this benchmark? |
|---|---|---|
| Accounting consistency | Boundary totalSupply vs. zero-address mint/burn logs |
Yes — Evidence 1 |
| Activity / flow confusion | Transfer count vs. supply delta; per-1k normalization; churn vs. net ratios |
Yes — Evidence 2 |
| Issuer control risk | Blacklist, pause, minter/admin changes, upgrades | No — requires control-log audit |
| Cross-chain movement risk | Source burn / message / destination mint trail | No — requires CCTP-style matching |
| Bridged backing risk | Wrapped supply vs. locked canonical collateral | No — on-chain collateral comparison |
| Liquidity stress | Pool depth, slippage, imbalance in stress windows | No — requires DEX pool state / swap logs |
| Oracle / price-feed stress | Oracle deviation, update timing, price-feed behavior in stress windows | No — requires oracle feeds and episode framing |
Rows marked No are explicit holes relative to causal claims—you cannot certify them via naïve event counters.
What this benchmark does not claim
This run does not establish reserve adequacy, liquidity depth, depeg probability, holder census, retail payment mix, macro cross-chain conservation, or issuer control risk.
Reserve arguments hinge on attestations parallel to ledger logs; liquidity hinges on venues the token touches but this bundle never opens; routed settlement demands message-level linkage; summing heterogeneous totalSupply snapshots yields pseudo-global circulating supply, not audited stock.
Summing deployments is not global circulating USDC.
Next layers: control, bridges, liquidity
Accounting is scaffolding, not climax. Closing the loop institutionally implies paired evidence: admin logs, burn↔mint message traces, bridged locker collateral, episodic liquidity depth, oracle prints—each as a falsifiable proposition with its own ingest, not inferred from whichever chain has the largest Transfer count.
Closing
Peg charts compress price. Blunt transfer tallies compress mechanism. Once totalSupply arithmetic locks, separating ERC-20 event intensity, deployment-local issuance/destruction net, churn-vs-net curvature, and cross-chain attestations you do not yet have is the difference between narration and auditability under defined scope.
Forecast I am comfortable making: dashboards that silently merge these layers will become less useful as routed mint/burn flows and low-fee L2 traffic dominate the surface area—especially when participant mix is not pinned down by deeper telemetry.
Where I would spend the next sprint: ingest that pairs canonical burns/mints across routes (CCTP or otherwise) before arguing why a deployment went negative; entity clustering before arguing which actors drove Base’s transfer count; gross-to-net and per-1k columns as obligatory warnings whenever someone tries to monetize headline “USD moved last Tuesday.”
Appendix: reproduction
Artifacts: docs/benchmarks/usdc_7d_20260501_20260508/.
Run id: usdc_7d_20260501_20260508.
cargo run --release -- resolve-window \
  --chains ethereum,base,arbitrum \
  --from 2026-05-01T00:00:00Z --to 2026-05-08T00:00:00Z

cargo run --release -- transfer-audit --asset USDC \
  --run-id usdc_7d_20260501_20260508 \
  --window arbitrum:458085624:460491249 \
  --window base:45402127:45704526 \
  --window ethereum:24996368:25046605

cargo run --release -- cross-chain-summary \
  --asset USDC --run-id usdc_7d_20260501_20260508
Derived columns
- Net supply (USDC) =
onchain_delta_raw/ 10^6. - Share of transfers = chain deduped count ÷ 25,205,190 (17,208,596 + 4,866,248 + 3,130,346).
- Per 1,000 transfers = net supply USDC ÷ (transfers / 1,000).
- Gross-to-net (tabulated) uses (sum mint + sum burn raw) / abs(
onchain_delta_raw), after scaling both sides consistently to M USDC (/ 10^12convention used in Figure 3 and text).