Where RWA Flow Leaves Traces
When RWA trading becomes a clean service, which parts of the path stop being visible?
The analogy I keep coming back to is not that RWA is another subprime trade. It is about abstraction. Before the financial crisis, many buyers did not inspect mortgage risk loan by loan. They experienced it through cleaner wrappers: bonds, ratings, tranches, yields. The wrapper made the exposure tradable. It did not make the underlying debt easier to inspect.
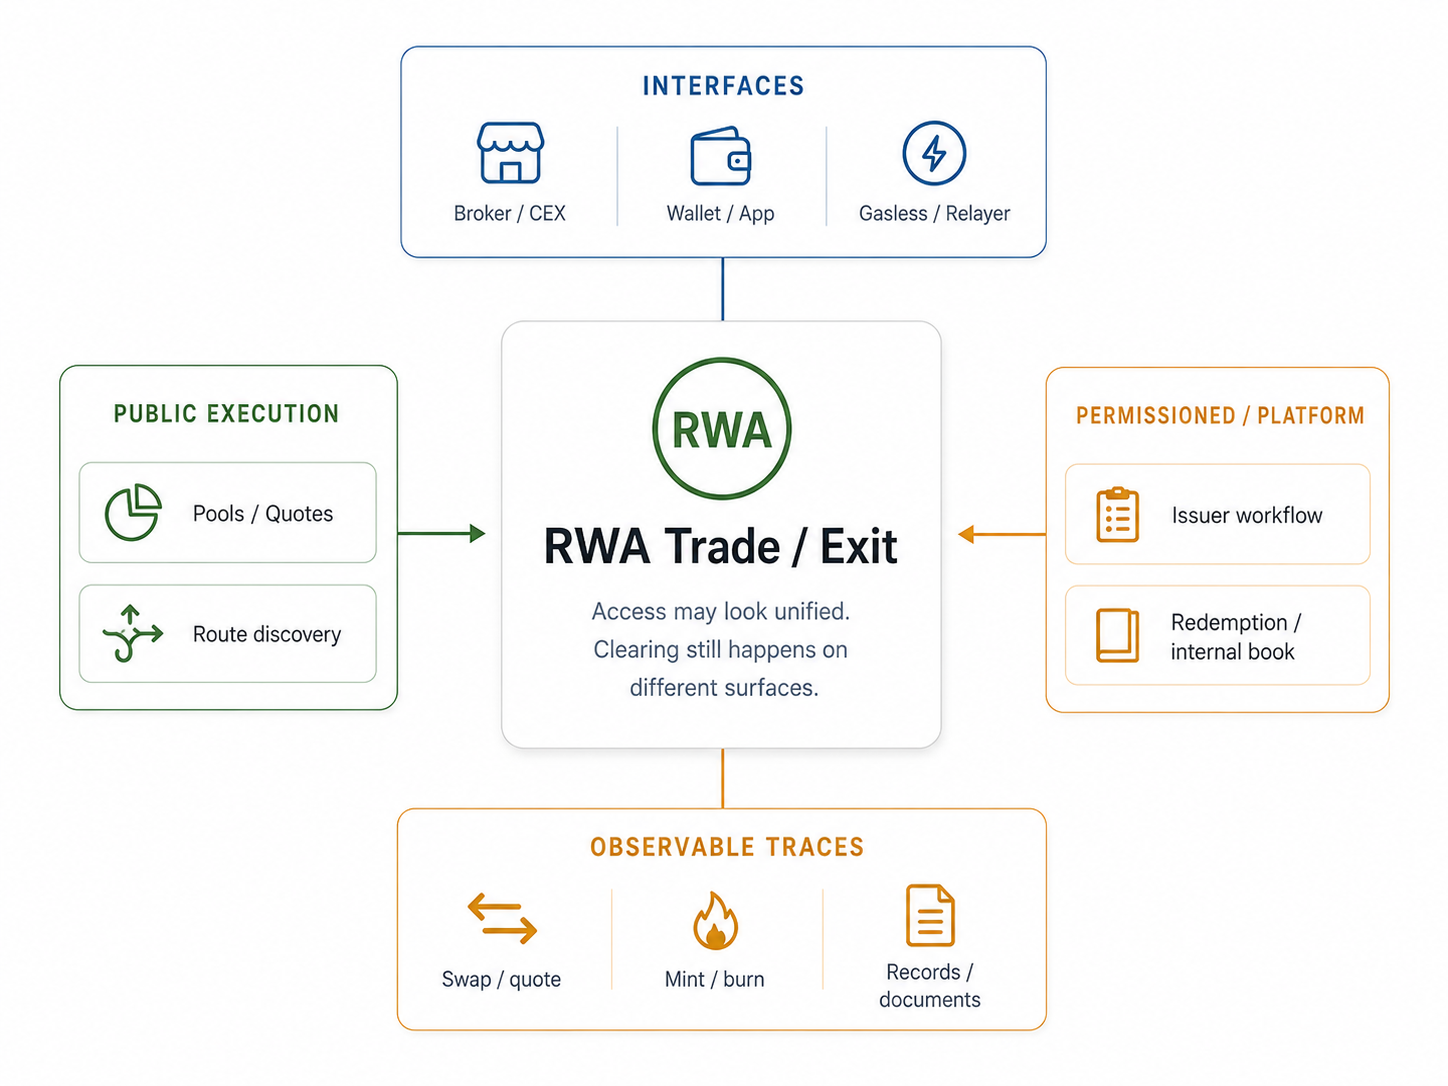
Tokenized and gasless RWA trading creates a smaller version of that audit problem. You see a ticker, a quote, a balance, maybe a sponsored transaction with no gas to sign. Behind that screen the fill may come from a public AMM, an aggregator route, platform matching, market-maker inventory, a relayer, or an issuer-gated redemption workflow—and in some cases no immediate public on-chain event at all.
I am not arguing that gasless is bad. The question is whether hiding gas also hides where the trade cleared—and whether that path is verifiable on-chain.
Part I looked at what tokenization makes visible: transfers, holder graphs, mint/burn events, permissioning rules. The asset itself is still somewhere else. This piece asks what becomes hard to see when the trade is packaged as a service.
Public RWA dashboards (e.g., rwa.xyz), are useful for locating the market: issuers, asset classes, holders, transfer volume, APY, and aggregate value. I use them as maps, not as the audit itself. Once an asset looks active, the harder question is which execution surface carried the user-facing action, and which record proves it.
A useful RWA analysis tool should first draw the path, not rank the asset. ERC-20 standardizes how a balance moves:totalSupply, balanceOf, transfer, approve, allowance, and transferFrom, not what the balance legally means or which off-chain record is authoritative.
The newer UX layers make this more important, not less. ERC-4337-style account abstraction can split the user action across a user operation, bundler, and paymaster. ERC-4626 standardizes deposit and redeem for DeFi vaults, but an RWA redemption can still sit behind issuer rules, eligibility checks, and off-chain records. Intent-based UX goes further: the user states a goal and another layer chooses the route.
Before I trust TVL, volume, quote success, or correlation, I want to know what the metric is attached to: a pool, a quote route, a platform ledger, a mint/burn log, a redemption document, or nothing public enough to verify. This is a flow-path audit, not a reentrancy audit.
The cases below are not one market. They sit in different RWA structures and leave evidence in different places:
- PAXG: tokenized gold; each token maps to vaulted physical gold. In this panel, public AMM pools are the main on-chain read.
- USDY: tokenized yield note backed mainly by short-term Treasuries and cash-like assets; broader on-chain access than the fund products below.
- BUIDL: BlackRock’s tokenized money-market fund; institutional and permissioned on issuance and transfer.
- OUSG: Ondo’s institutional Treasury product; eligibility-gated subscribe and redeem, with permissioned on-chain flows.
- AAPLx / xStocks: tokenized equity exposure through a platform interface; platform matching and token-level pools do not necessarily show the same activity.
They can all look tradable from the screen. I am not comparing which is larger. I am comparing where a trade or exit leaves something inspectable.
The representation can live on-chain. Liquidity formation does not have to. I started with public pools: a 90-day panel, cross-product comparison, and that was still too clean.
The panel window is 2026-03-10 to 2026-06-08 on Ethereum mainnet public pools unless stated otherwise. ETH gas and BTC absolute returns were not meaningfully associated with PAXG or USDY pool-volume relationships in this panel. USDC daily transfer counts could not be collected reliably, Alchemy eth_getLogs responses exceeded size limits on every day attempted, so funding-rail diagnostics were left blank rather than inferred. Those null results matter; they are not hidden.
PAXG was where the reference market actually helped
COMEX gold futures and a pool-routing read can sit on the same calendar in the 90-day panel.
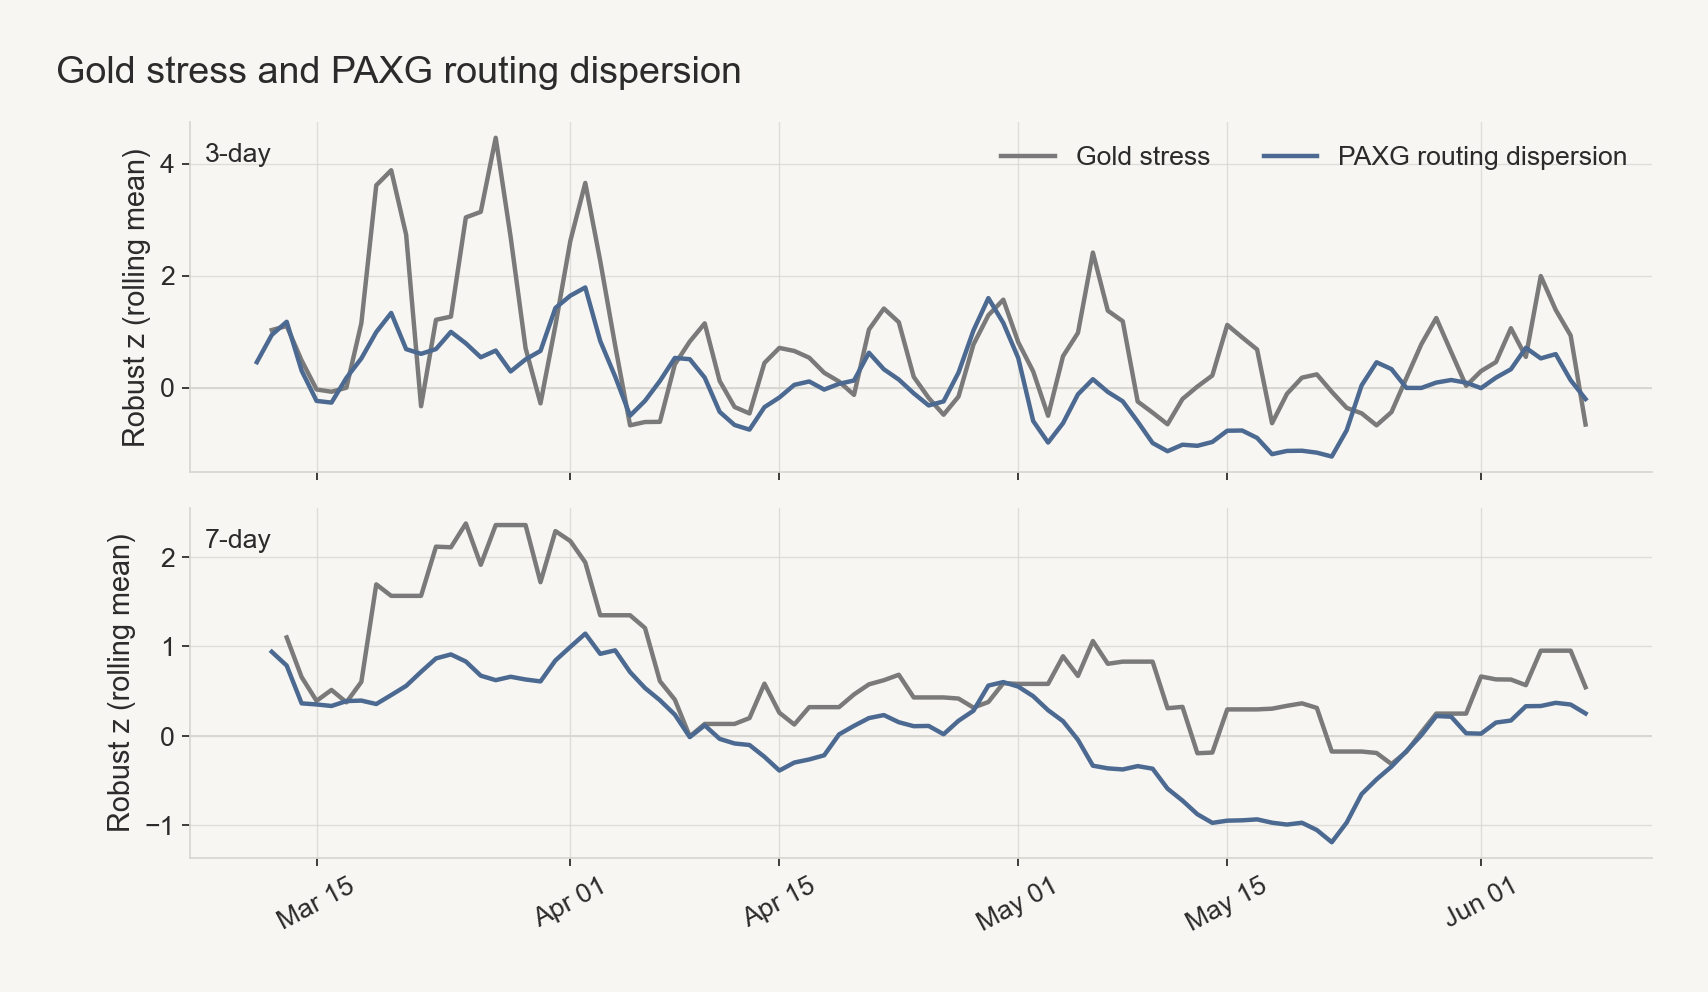
The core signal is reference stress showing up in how volume routed, not in one headline number. Higher gold-reference stress coincided with volume spread across more pools in time (gold abs-return z vs dispersion z: r about +0.51, n = 90). When stress rose in late March 2026, public routing looked less dominated by the top pool. That does not prove causality; it is consistent with broader venue use rather than flight to one pool.
Underneath that pattern, the public surface was active but fragmented: PAXG showed volume on 91/91 days and about $4.8M median daily volume, yet median top-pool volume share was still about 84%. A June 9 cross-section showed why reserve TVL alone is misleading: the top pool held only about 27.9% of observed reserves, far below its volume share.
Transaction 0xf627… shows the log-level floor: PAXG Transfer, USDC Transfer, and a Uniswap V3 Swap in one hash. Weekly ParaSwap route tests returned paths through $100k at all 13 checkpoints—aggregator API tests, not completed trades.
USDY looked active until I asked for size
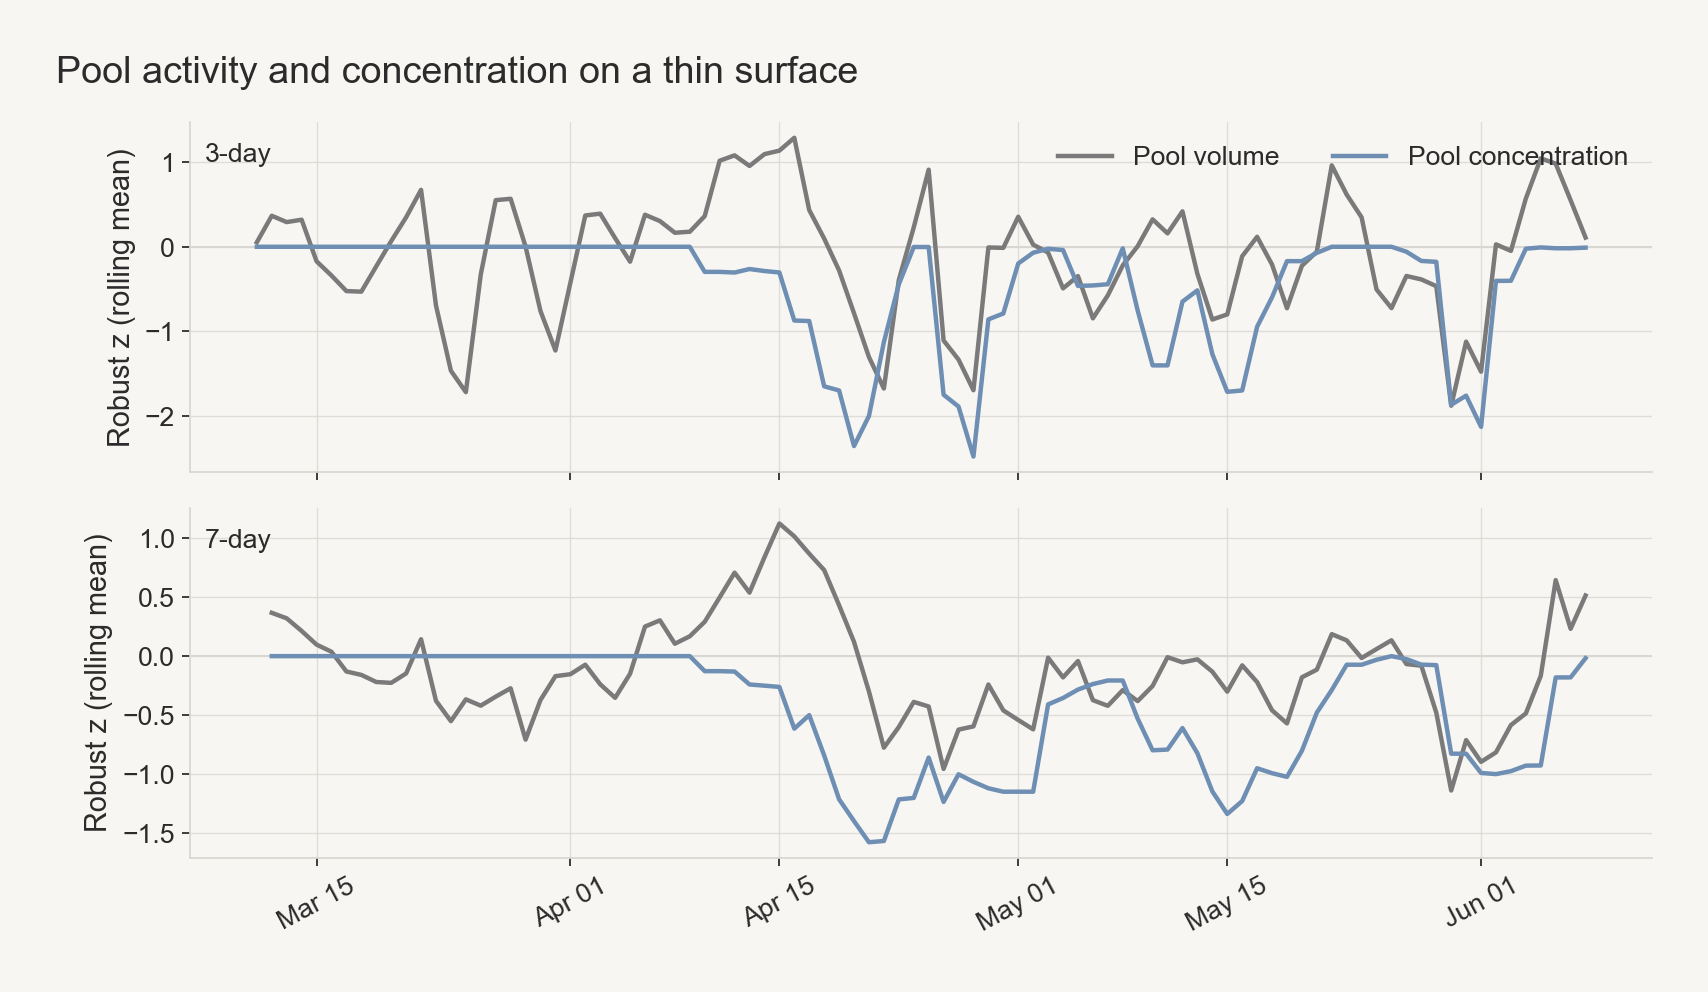
USDY does not show a clean reference-linked response; instead, bursts in public-pool activity coincide with concentration and a quote boundary that did not move at larger tested sizes.
USDY pool-volume bursts were associated with higher top-pool concentration (volume robust z vs share robust z: r about +0.49, n = 91). Raw top-pool share sat at or near 1.0 on about 66% of days—a ceiling that makes concentration the readable response metric rather than a unified dispersion scale borrowed from PAXG. Gold, BTC, and ETH gas did not show meaningful alignment with USDY pool volume in this panel. Fragility proxies: volume CV 1.72 vs PAXG 0.66; spike ratio about 33× vs 5×; median daily volume near $1.5k on 89/91 active days with median active pool TVL near $40k.
A public pool can show activity without expanding what a holder could actually exit at size.
The tested route stopped between $10k and $100k: smaller quotes succeeded at every weekly checkpoint; larger ones did not return at any. A failed route response is an API-level boundary in this test setup—not a claim that no off-chain or permissioned exit exists. Ondo primary subscribe and redeem workflows are compliance-gated and mostly off the public AMM surface reviewed here. The split still matters: a swap quote, a pool print, and a permissioned burn are not the same evidence. Transaction 0x8be2f5… is a burn event—about 49,990 USDY burned, about 56,768 USDC through intermediate contracts—not a Uniswap swap. The May 22 pool spike is a fragility probe only, not a sourced demand event.
BUIDL and OUSG were not pool problems
For BUIDL and OUSG, I did not get a useful pool quote. The read sat in permissioned mint, transfer, and burn logs.
Transaction 0x4aea… on BUIDL produced 64 logs in one hash: 32 zero-address mint Transfer events to 32 distinct recipients, 32 non-Transfer events in the same transaction, and about 46,016.43 BUIDL minted in total. BUIDL had effectively no observed public DEX pool depth at review: settlement visible here, public swap surface absent. What the logs support is batch issuance to 32 recipients in one hash. What they leave open: whether each mint reflects new subscription cash, reallocation, bridge processing, or administrative batching; who funded what; investor identity. No subscription cash leg appears in the token event log reviewed here.
Transaction 0x762bcc… is the contrast in the same token: a single 980.25 BUIDL Transfer between allowlisted addresses: movement, not mint workflow. Not every dense BUIDL row is the same business event.
On the exit side, transaction 0x56634c… on OUSG shows about 18,533.97 OUSG burned with about 2.14M USDC moving through named intermediary contracts and returning to the redemption contract within the same hash. Burn and stablecoin movements are correlated in one transaction. Transfer logs show USDC cycling through intermediaries back to the contract, not a confirmed credit to the initiating holder’s wallet. OUSG redemption is eligibility-gated per Ondo product documentation. Secondary-holder entitlement, final payout rail, and legal effect remain open.
A control-plane read based on owner() alone was rejected in review: proxy, admin, and transfer-agent roles need a fuller role map than a single Ownable slot. Chain evidence ends where documents and role maps begin.
The dashboard row I removed
A DeFiLlama BUIDL row of roughly $829M initially looked like lending liquidity beside empty public pools. Review showed it did not map to a specific lending market, supplied collateral, borrowable liquidity, or a redeemable exit. It was asset/protocol TVL-style data, not a mapped exit. We removed it.
A dashboard row can look relevant while describing the wrong layer.
AAPLx is where the interface problem comes back
Sprint sources cited about $1.07B 30-day xStocks platform volume (platform-wide; per-token split not verified). A 2026-06-09 GeckoTerminal check found Solana AAPLx pool TVL near $215.75k and 24h volume near $100.06k.
A user can experience that as one AAPLx market. I could not connect a platform trade to a pool print or a wallet credit. Trade-to-chain correlation was not verified here. When funding or exit pressure shows up, this is the gap I would want to trace first: who provides liquidity, and which record proves the fill?
Closing
I do not trust a single liquidity number from this panel. The audit value is not “token on-chain, therefore transparent.” It is whether the flow path—exit, inventory, sponsor, platform ledger—leaves evidence you can inspect. The rejected BUIDL row was the warning: a dashboard number can look useful and still describe the wrong layer.
For simplicity, I used linear correlation as a screen, not as a conclusion. The 90-day panel cannot identify causality. It only helped me see which surfaces moved together, which ones stayed silent, and where I should go back to the actual path: quotes, pools, transfers, mint/burn logs, and platform records.
Appendix: reproduction
- Repo:: github.com/egpivo/rwa-audit
- Panel:: 2026-03-10 → 2026-06-08; Ethereum public-pool data, COMEX gold reference, ParaSwap quote checks, selected transaction-log reconstructions
- Artifacts::
data/flow/; figure scripts inscripts/plot/ - Transaction replay::
cargo run --bin rwa-flow-tx -- 0x<tx_hash> - Correlations:: computed from the saved 90-day panel files; live API re-runs may differ slightly.