When the Book Keeps Moving. What Hyperliquid Lets Outsiders Reconstruct.
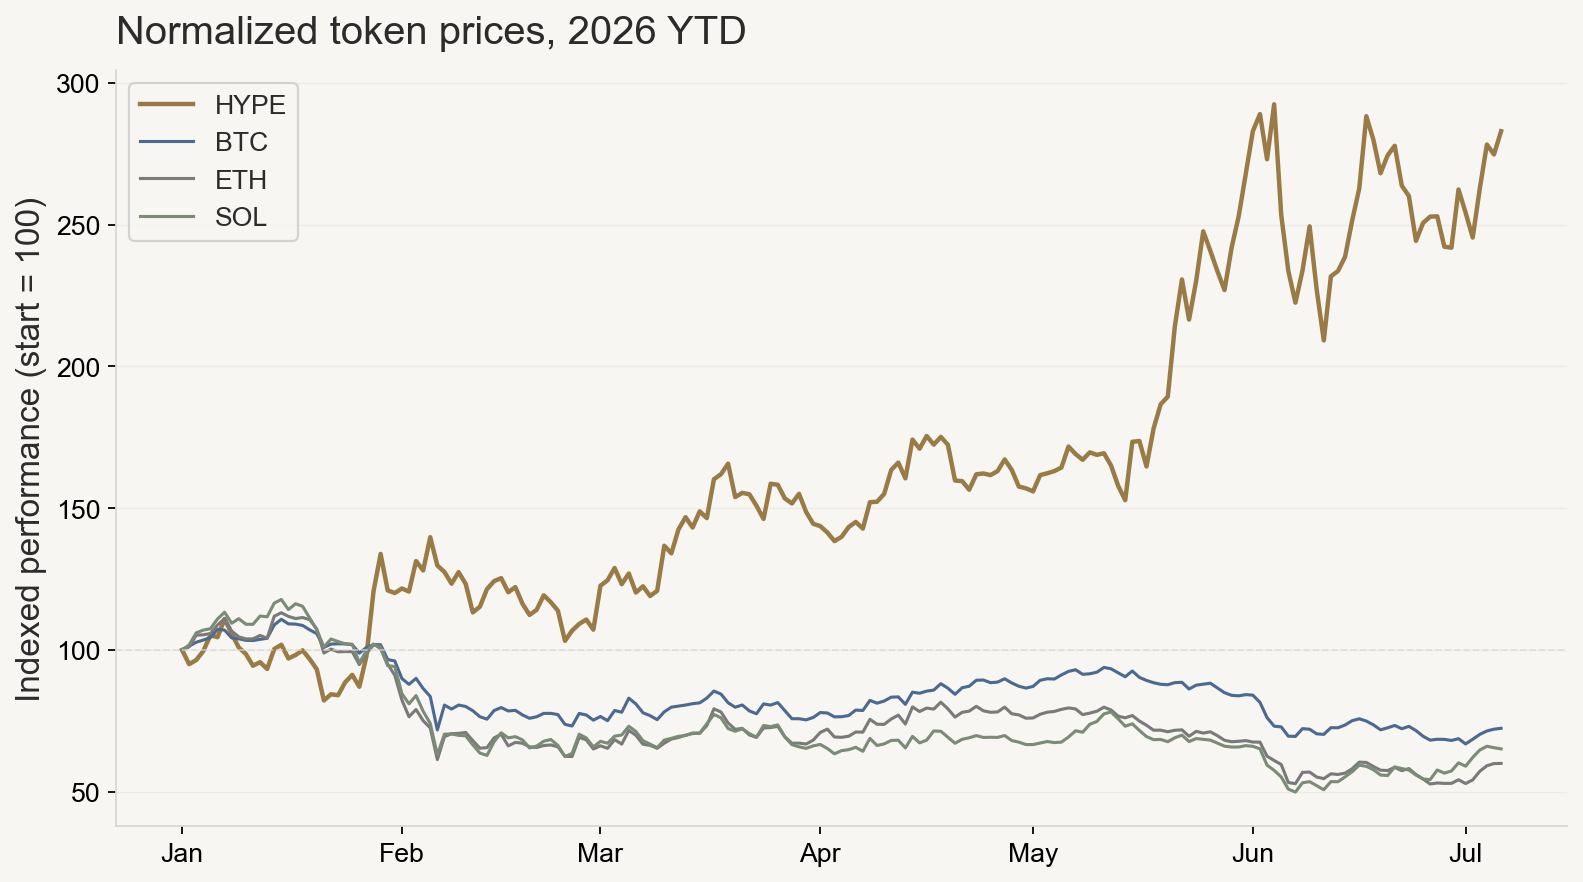
Hyperliquid first shows up as a price story.
In a weak crypto tape, HYPE kept attracting attention while the usual majors looked heavier. That does not prove anything about the venue’s market structure. A token chart is not an audit trail; price performance compresses flows, incentives, listings, buybacks, leverage, and narrative into one line.
But it does explain why the venue is worth opening.
The better question is not whether HYPE went up. It is what kind of market object sits underneath that attention, and whether the public book exposes enough state for an outsider to reconstruct the moving surface of the market, rather than just another exchange UI.
A pool snapshot and a book snapshot answer different questions, and this post is about what happens after the snapshot. A single l2Book pull is a measurement. An audit trail is a sequence.
That distinction came out of prior AMM work, where the recurring blocker was simpler: you cannot reason forward from a market state until the state object is defined. If the object is unstable, over-abstracted, or mixed in with hidden assumptions, a later monitor, rule engine, or learning loop risks fitting artifacts instead of mechanism. Hyperliquid became the next test case because its public CLOB surface looked archivable enough to try.
The AMM side has its own version of this problem. Bunni is a compact hook-side example: its post-mortem traced the failure to Bunni’s own accounting logic, not to Uniswap v4’s core swap math. Once a pool adds custom defense logic on top of the AMM, that logic becomes part of the state machine an auditor has to follow, and it needs sequence-level audit, not a single balance check.
Hyperliquid hands the same problem a different object. There are no pool reserves or hook accounting here. The state is a moving book: posted depth, trades, funding, open interest, mark-oracle premium, and reference mids pulled from other venues.
Hyperliquid starts from a different object
The static contrast is familiar: callable inventory versus posted depth.
An AMM pool can usually be inspected as a compact state object: reserves, liquidity range, fee tier, swap logs, pool price. A CLOB has to be watched as a moving surface instead — book updates, trades, funding, open interest, mark-oracle context, and basis against reference mids. Cancels and reposts often show up only as depth that moved between snapshots, with no event marking the change.
On the AMM side, the market object is still a pool: reserves, curve state, LP accounting, fee logic, and now hook state. Hooks and dynamic fees are an attempt to make that passive inventory more conditional, which is closer to what a CLOB order already is by default — posted at a price, for a size, until the maker cancels, until it fills, or until risk changes.
On the CLOB side, the object is posted depth backed by active makers, margin rules, funding, and a risk engine, not a pool defending passive inventory. The visible stress signals follow from that: spread, visible depth, signed flow, funding, OI, mark-oracle premium, and basis. Neither surface is being scored as safer here; the object being inspected is just different.
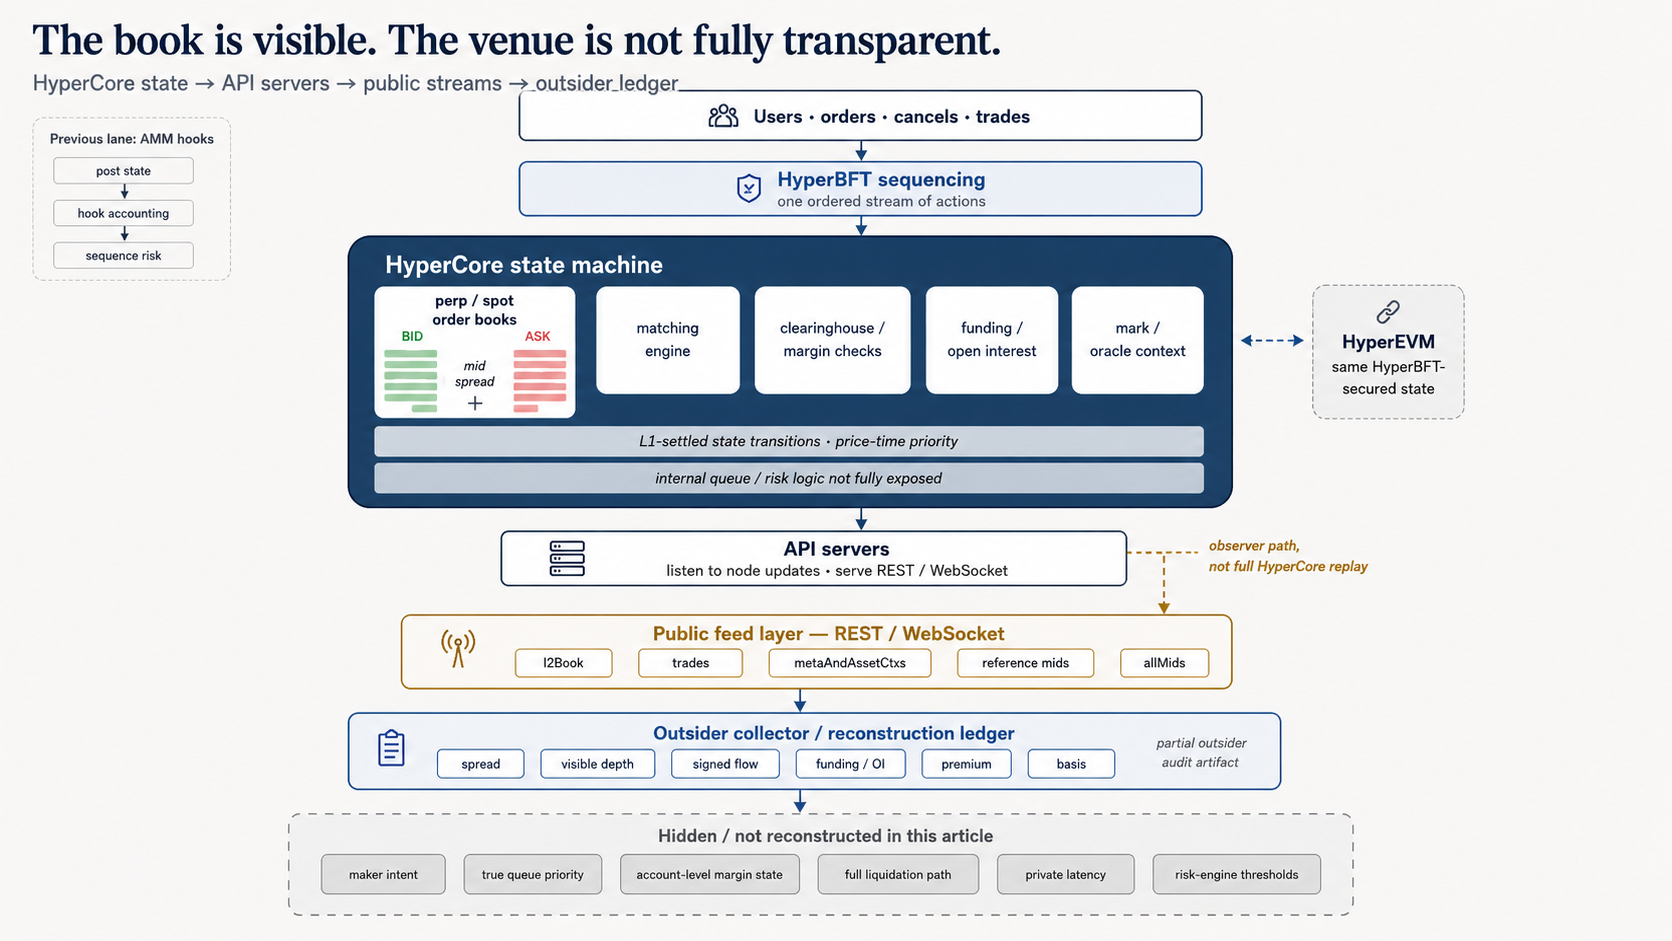
Hyperliquid documents the book as HyperCore / L1 state with price-time priority matching. The public info API and WebSocket path are the outsider observer path — twenty visible levels per side, callable from outside, which is what makes the book L1-settled, API-observable, and self-archivable in the first place. Archive the public streams, normalize the rows, and label what never entered the artifact.
What the architecture makes observable
This matters because the public stream is not the same thing as HyperCore itself. HyperCore includes the order books internally; what the API exposes is an observer path, not a byte-for-byte replay of that internal state.
Three layers fall out of that. Public feeds — l2Book, trades, metaAndAssetCtxs, external reference mids — are the first. Derived metrics come second: spread, visible depth, imbalance, signed flow, funding/OI movement, mark-oracle premium, cross-venue basis. The third layer stays hidden regardless of how long you collect: maker intent, true queue priority, private latency, account-level margin state, the full liquidation path, risk-engine thresholds.
Reconstructing the moving book
There is no point reasoning forward from a book state if the book state itself is only a screenshot, so the first task here is reconstruction, not prediction.
The workflow is plain: archive public streams, normalize them into book-timestamped rows, join nearest-prior perp context and reference mids, compute derived fields, and mark gaps instead of filling them.
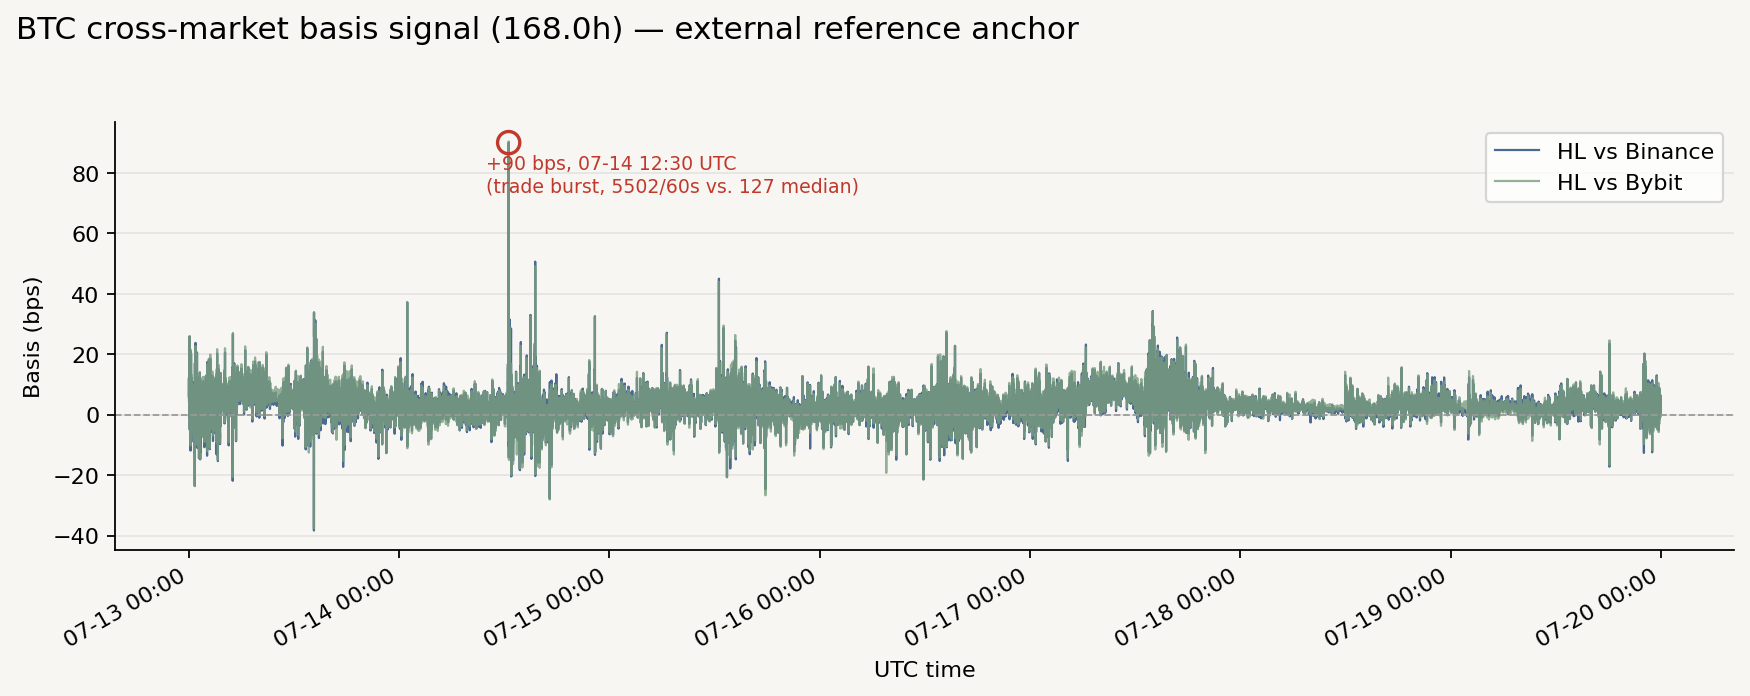
A local collector on BTC, ETH, and SOL pulls WebSocket l2Book and trades, periodic metaAndAssetCtxs, and Binance/Bybit perp mids as external anchors. Basis here is a reconciliation signal, not a mispricing verdict. The output is a partial outsider artifact — one row per book observation with spread, visible depth bands, sixty-second signed flow, joined meta fields, cross-market basis, and gap flags.
Any future monitor, rule engine, or agent that uses this data inherits the same observable boundary: it cannot act on maker intent or hidden margin state, because those never entered the artifact to begin with.
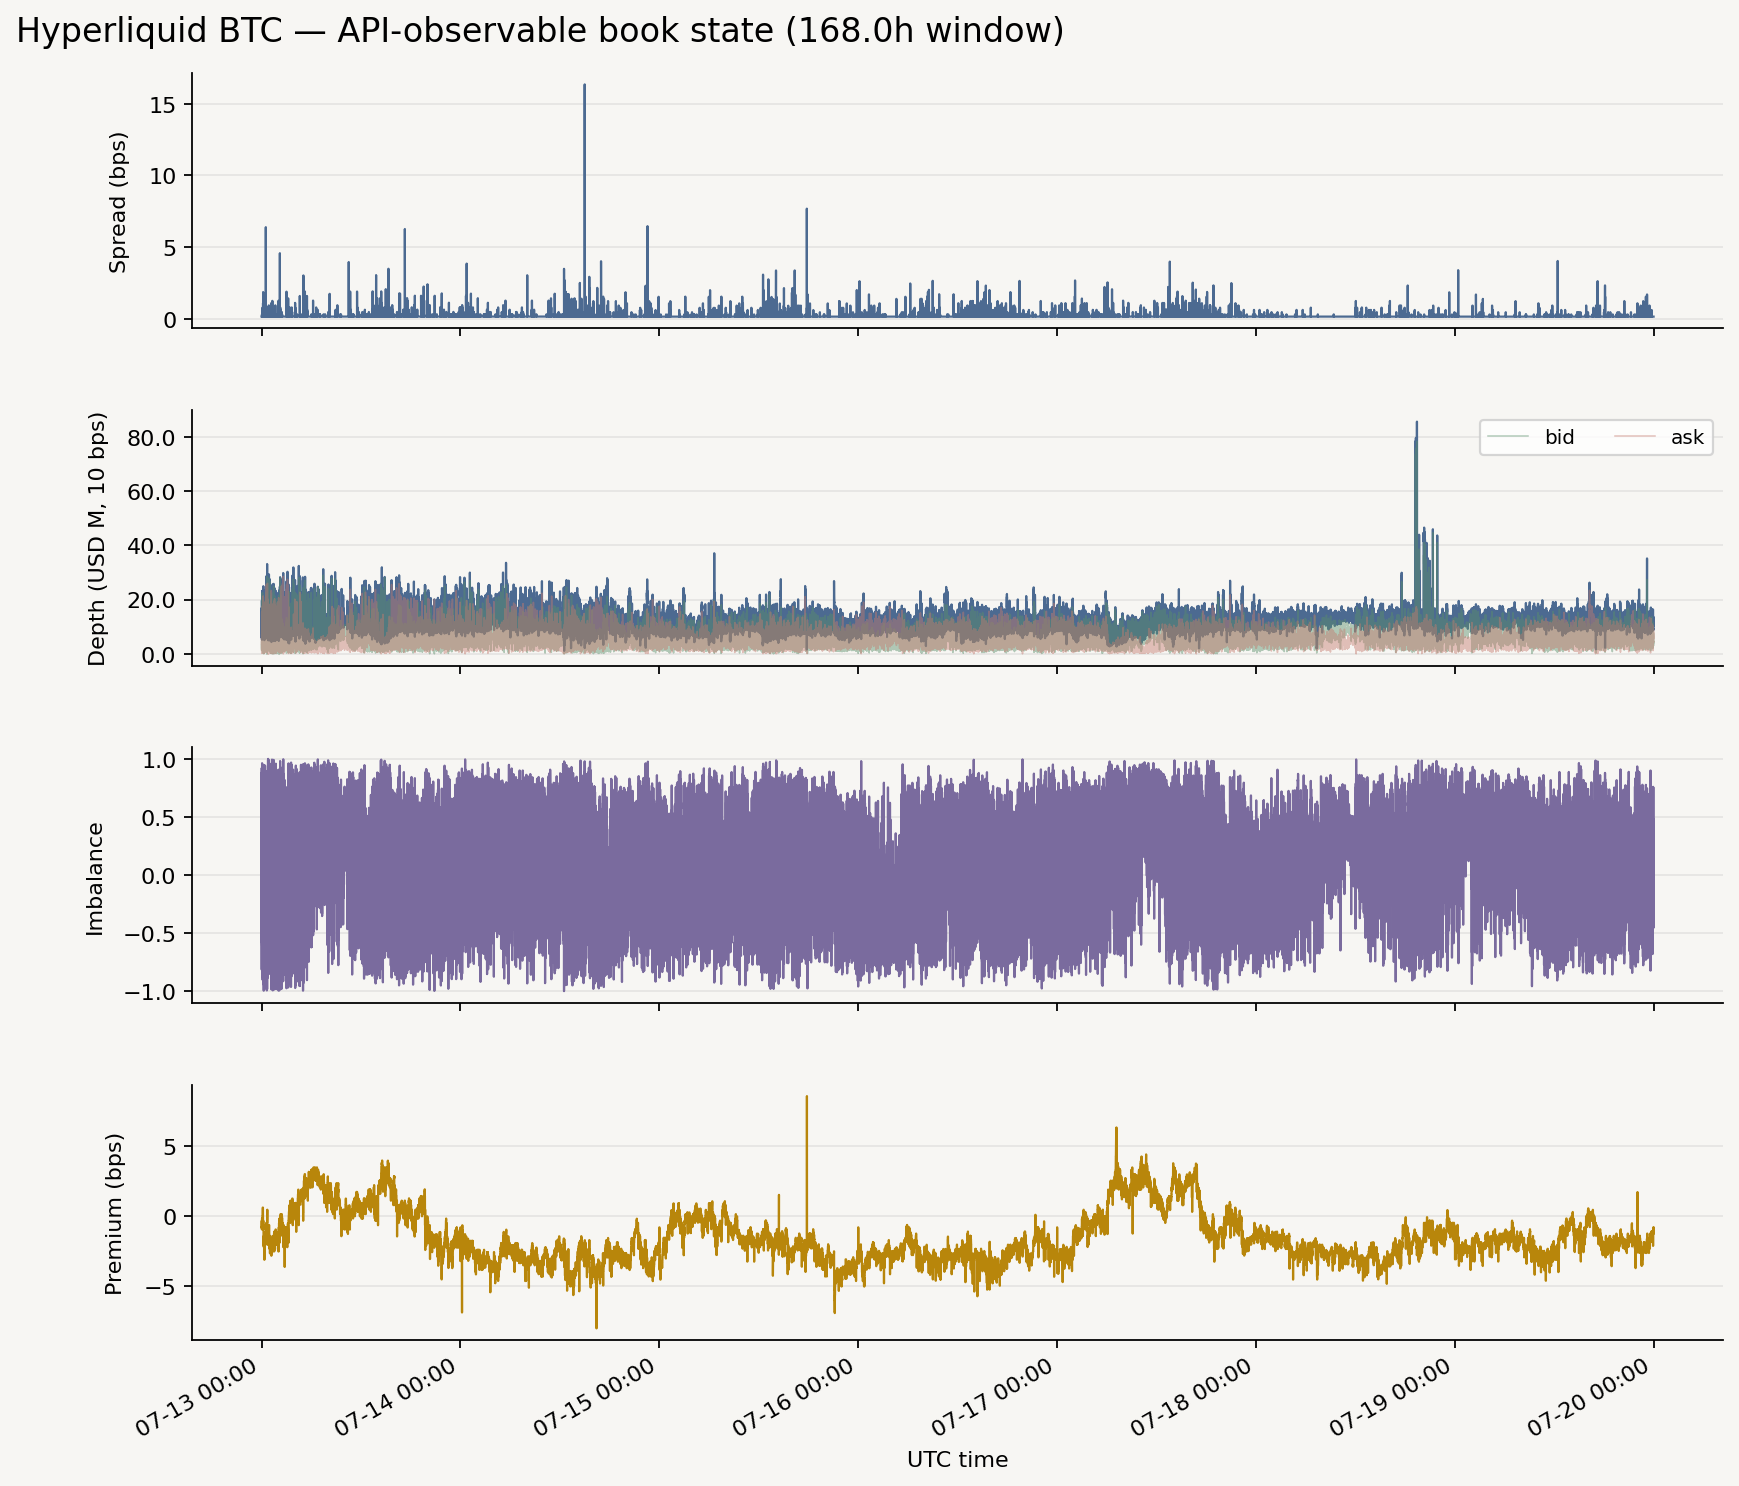
The figures below use a 7-day (168 h) collection window (2026-07-13T00:00Z–2026-07-19T23:59Z; 112,626 BTC book rows) — the longest fully continuous stretch in a roughly two-week collection run, with no reference-feed or WS outages inside it. One joined row from the middle of the run shows how the fields line up: at 11:59:44 UTC on Jul 16, spread 0.16 bps; visible 10 bps depth ~$10.6M; sixty-second signed flow ~−$79k; funding joined from the nearest-prior meta poll; HL mid within a few bps of Binance and Bybit mids.
This row does not explain maker intent, queue priority, or liquidation causality. What it does show is narrower: the book, trade tape, perp context, and reference mids join into one defensible outsider market-state artifact.
What a week of the book looks like
Liquidity, leverage, and pricing stress
The joined row above reads through four surfaces. Liquidity: sub-bps spread with thick visible near-mid depth. Pressure: heavy sell-side signed flow, with the visible book leaning ask-heavy while takers hit the bid. Leverage: funding from the joined meta poll, with no obvious crowding signal in a single row. Pricing stress: HL mid tracking external mids rather than drifting wide.
Rule-based flags on the ledger are stress screens, not accusations. Over the 7-day window, percentile flags rest on a firmer baseline than the original 32 h pilot, but still short of the 30-day target; a 30-day archive remains the actual target for any market-structure claim.
None of these screens separate genuine resting depth from latency-driven quote churn. A maker refreshing the same size every few hundred milliseconds looks, in this row schema, identical to a maker with real conviction at that price — the ledger records depth, not intent behind it.
What remains hidden
Even with a running collector, the outsider still does not see maker intent, true queue priority, private latency, account-level margin distribution, the full liquidation path, or risk-engine thresholds.
Public depth can disappear without a trade. Public fills carry no maker labels. Cross-venue basis diverges for reasons that are not automatically mispricing or routing alpha — the CPI row above is one instance of a basis spike with a plausible but unverified explanation.
That incompleteness is not a footnote to clean up later; it is most of the point of keeping the ledger at all. What the ledger is good for is not seeing everything, but recording exactly what entered the artifact and what stayed outside it, and doing that continuously enough that the boundary itself becomes measurable over time instead of guessed at from one screenshot.
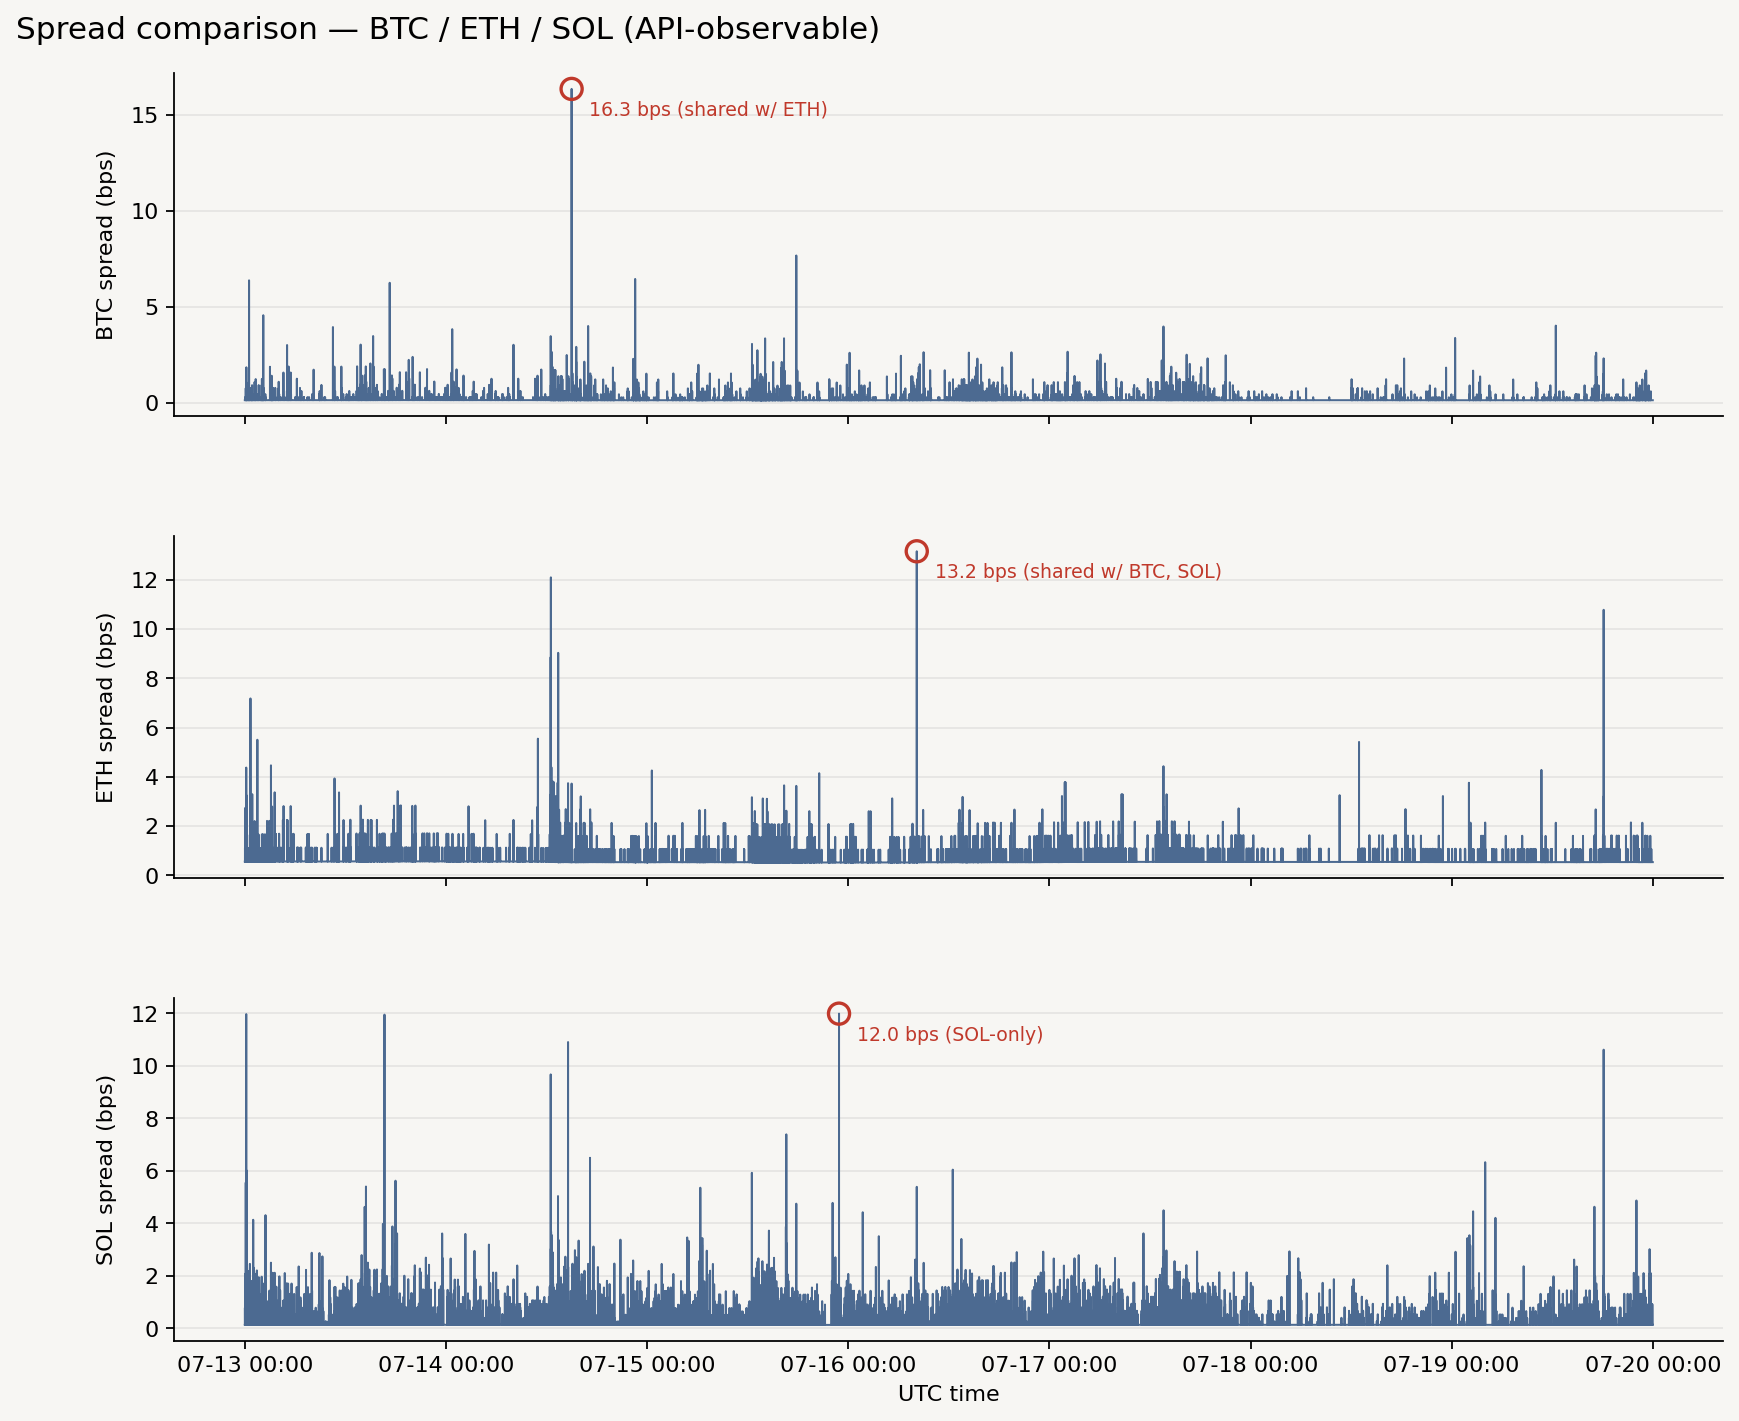
Reconstructing the public book is useful not because it restores the venue’s full internal truth, but because it turns an opaque stream into a state object that can be monitored, compared, and stress-tested — the spread and depth spikes in Fig. 2 double as alert thresholds, and the flat-OI-plus-volume-burst read in Fig. 4 is one instance of narrowing an explanation, not just describing a chart. That is enough to support alerting, event attribution, and execution or risk decisions, without needing a completed picture of maker intent behind them.
Closing
The point was never Bunni itself. It is the object an auditor has to follow.
On the AMM side, the live questions are dynamic fees, hooks, and LP loss surfaces — state that only makes sense read across a sequence. On the CLOB side, the live questions are a moving book, funding and OI, mark-oracle premium, basis, and the hidden venue state behind them. Both lanes fail the same way when the audit object is left vague: reasoning forward from a screenshot.
A public book does not solve the audit problem so much as relocate it. The next check on this data is not a bigger dashboard — it is whether a 30-day version of the same ledger holds up the CPI-basis read above as a repeatable pattern (macro print → volume burst → basis spike → flat OI) rather than a one-window coincidence.
Appendix: collection and reproducibility
Window: 2026-07-13 → 2026-07-19 UTC (7 days, 168 h). Coins: BTC, ETH, SOL — roughly 112,600 rows each. This was the longest stretch in a ~2-week collection run with no reference-feed or WebSocket outage inside it; those gaps show up elsewhere in the run as missing rows in Fig. 4, not as a fabricated basis reading.
Limitations: visible l2Book levels only; nearest-prior join for perp meta and reference mids, dropped rather than carried forward past 5 minutes of staleness; a 7-day run, not yet the 30-day market-structure study this points toward.
Reproduction: Gist appendix (archive_io.py, collect_ws_ledger.py, collect_ref_mids.py, build_ledger.py, build_figures.py).
- Bunni post-mortem: blog.bunni.xyz
- Jul 14 CPI/BTC context: CoinDesk