Measuring a Commodity Shock in Tokenized Markets with a Rust CLI
On 8 July 2026, renewed U.S.–Iran escalation coincided with opposite moves in two commodity benchmarks: spot gold fell 0.52%, while front-month WTI settled 4.4% higher. The same Reuters market report carried both numbers.
The benchmarks moved. The open question was whether the tokenized markets moved with them—by how much, and whether those responses stuck.
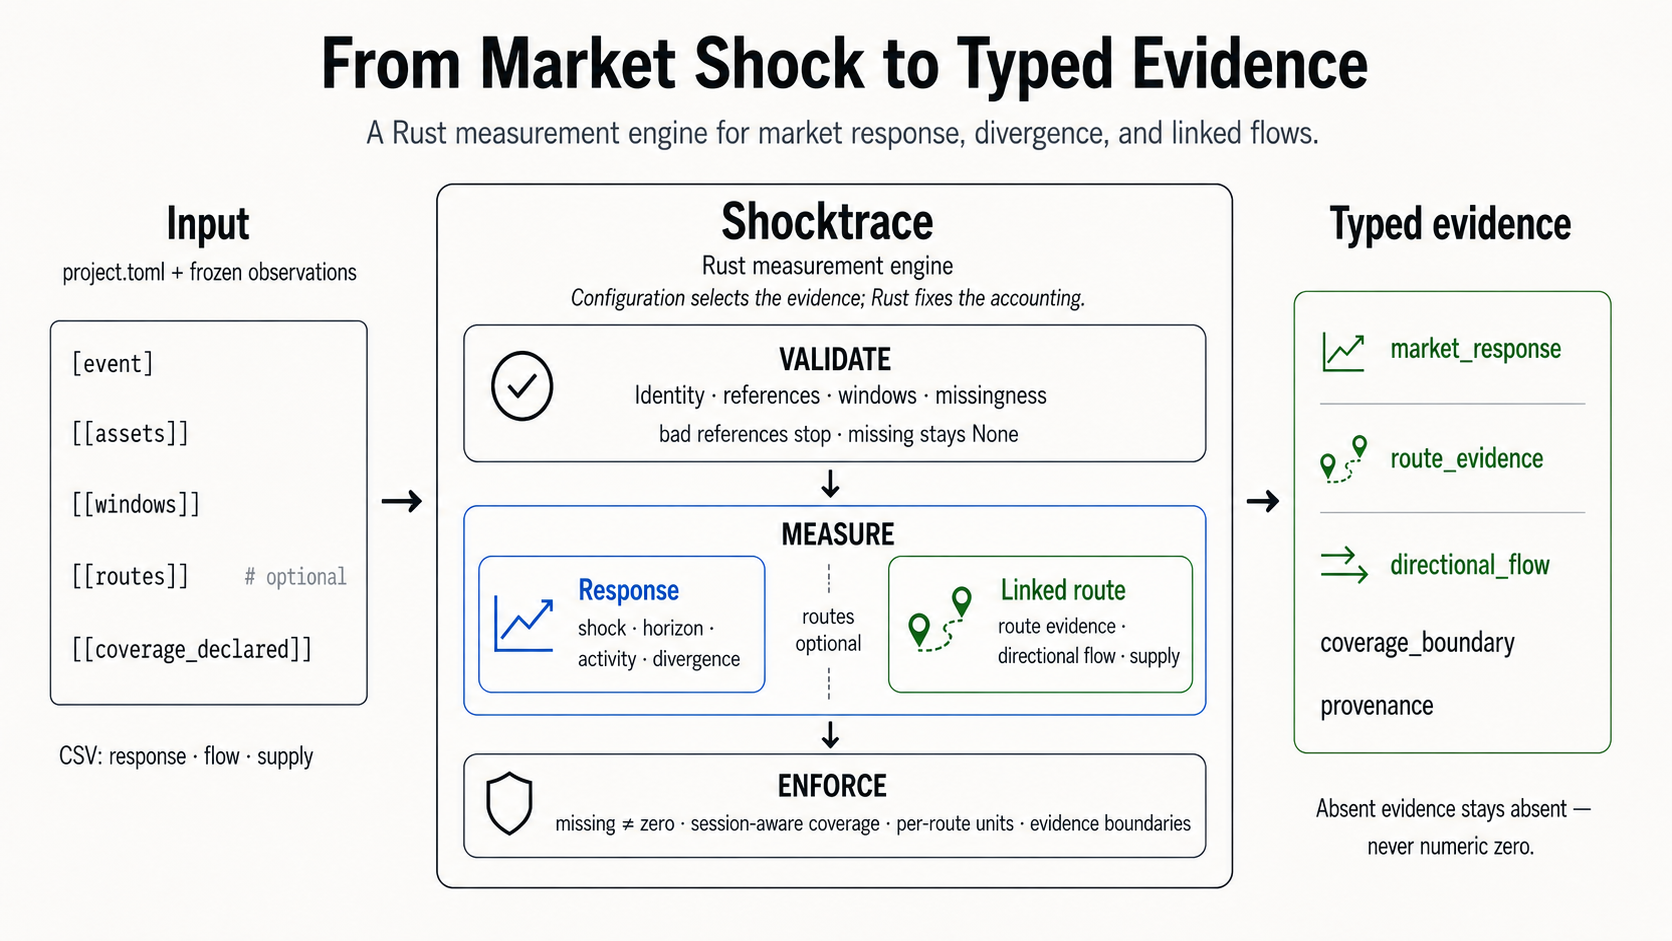
Shocktrace is the tool for that question. It freezes a shock case—identities, windows, on-chain marks, and reference returns—then returns typed measurements with the cutoffs needed to read them. This piece runs one case through it.
Four checks:
- Same direction as the paired commodity benchmark?
- Unusual relative to the token’s own baseline?
- Persist or reverse after the event close?
- Unusually large gap between the two tokens?
Markets Are Full of Roads followed a visible SpaceX route. The distinction still matters here: market response is observable; capital moving between PAXG and WTIC is not.
The Missing Comparison Was a Response Gap
The first Shocktrace build could standardize a token return, trace its later path, and compare two tokens. It could not keep an external commodity move and the token response inside one measurement object.
Putting a news percentage beside an engine result would make the comparison in prose. I wanted it in the measurement contract:
frozen reference return + same-date token return
                         ↓
                   response gap
                         ↓
           direction + magnitude + cutoff boundary
The response branch now exposes four measurements—response-gap, shock, horizon, and divergence. Linked flow remains a separate evidence path.
This is a same-date comparison, not a causal transmission model. response-gap computes one descriptive quantity:
response gap = token return - reference return
Configure a Case, Extend a Metric
Shocktrace separates two kinds of work:
- A new shock case adds a project directory, frozen observations, and a TOML contract.
- A new measurement adds Rust accounting code that any project can call.
Each case is a project.toml plus frozen response and reference inputs. The excerpt below shows the schema shape; the full project also freezes the baseline/event windows and the WTIC asset block.
[event]
id = "us_iran_renewed_escalation_2026_07_08"
timestamp = "2026-07-08T00:00:00Z"

[[assets]]
key = "PAXG"
chain = "ethereum"
erc20 = "0x45804880de22913dafe09f4980848ece6ecbaf78"
session_calendar = "continuous"

[response]
baseline_window = "baseline"

[inputs]
response = "data/response_daily.csv"
references = "data/reference_returns.csv"
00:00Z anchors the project date; it is not an event-time synchronization point. The shared asset_key joins response_daily.csv to reference_returns.csv.
shocktrace validate projects/paxg_wtic_reference_2026_07_08
Validation catches undeclared assets, missing inputs, duplicate observations, and invalid windows. After that, the same project drives response-gap, shock, and divergence. For a new event, I change the project inputs and reuse the same accounting code.
The load-bearing line is deliberately plain:
let response_gap =
    token_return.map(|value| value - reference.reference_return);
Option::map keeps a missing token return as None; the summary carries source, cutoff, direction match, and the evidence boundary.
Freeze the Shock and the Tokens
The frozen reference file holds two event-day observations:
GOLD_SPOT: −0.52%, paired with PAXG.WTI_FRONT_MONTH: +4.40%, paired with WTIC.
For WTIC, WTI_FRONT_MONTH is the commodity benchmark chosen for this comparison—not a claim that the token tracks or redeems against that futures series.
These are same-date comparison points, not synchronized clocks. Reuters’ spot-gold observation and WTI settlement are not aligned to the UTC on-chain candles, so the engine reports a response gap—not beta or tracking error.
The measured markets:
- PAXG: Paxos Gold on Ethereum,
0x45804880de22913dafe09f4980848ece6ecbaf78. - WTIC: WTI Coin on Ethereum,
0x709ab533D18e652eCd56423d71c0241A0ee56a3b.
PAXG price is a daily USD VWAP across twenty frozen Ethereum pools quoted in USDC, USDT, or DAI. WTIC uses the only eligible pre-event Uniswap v3 WTIC/USDC pool. Both series use UTC candle dates.
Question 1 — Did the Tokens Register the Shock?
The same project commands reproduce the tables below.
shocktrace measure response-gap projects/paxg_wtic_reference_2026_07_08 \
  --asset PAXG --reference GOLD_SPOT

shocktrace measure response-gap projects/paxg_wtic_reference_2026_07_08 \
  --asset WTIC --reference WTI_FRONT_MONTH
| Benchmark | Benchmark return | Token | Token return | Gap | Direction |
|---|---|---|---|---|---|
| Gold spot | −0.52% | PAXG | −0.92% | −0.40 pp | same |
| WTI | +4.40% | WTIC | +3.89% | −0.51 pp | same |
Direction matched on both legs. PAXG fell 0.40 percentage points more than the reported spot-gold move; WTIC rose 0.51 points less than the reported WTI move.
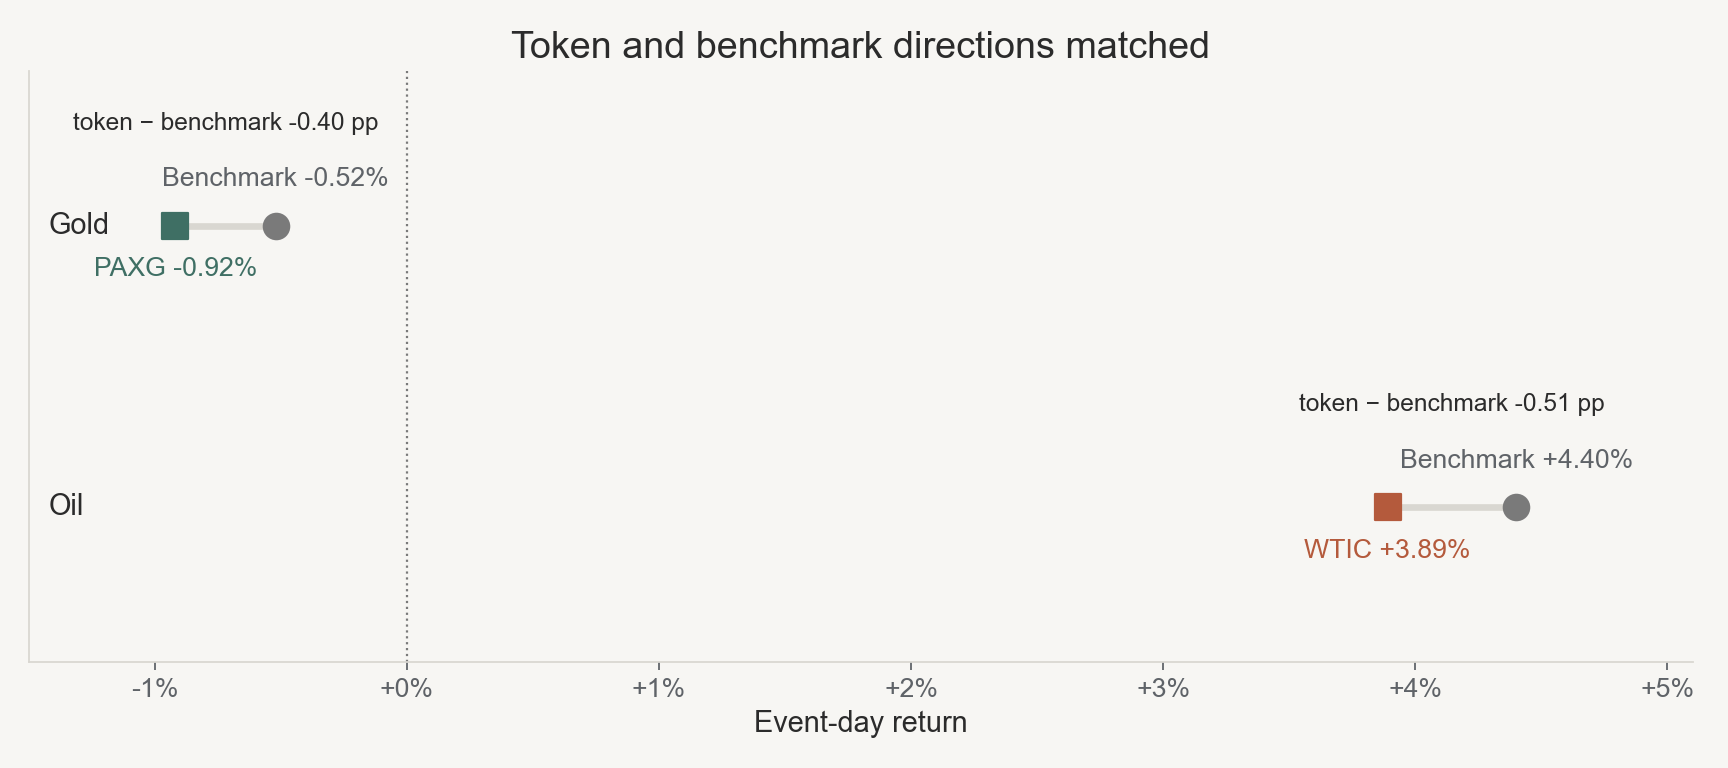
Without the retained cutoff, −0.40 pp would look more precise than the clocks allow.
Question 2 — Was the Token Move Unusual?
Direction match does not say whether the token itself had an extreme day. Shocktrace compares each event return with that token’s own frozen baseline distribution.
| Token | Raw return | Standardized return | Baseline returns |
|---|---|---|---|
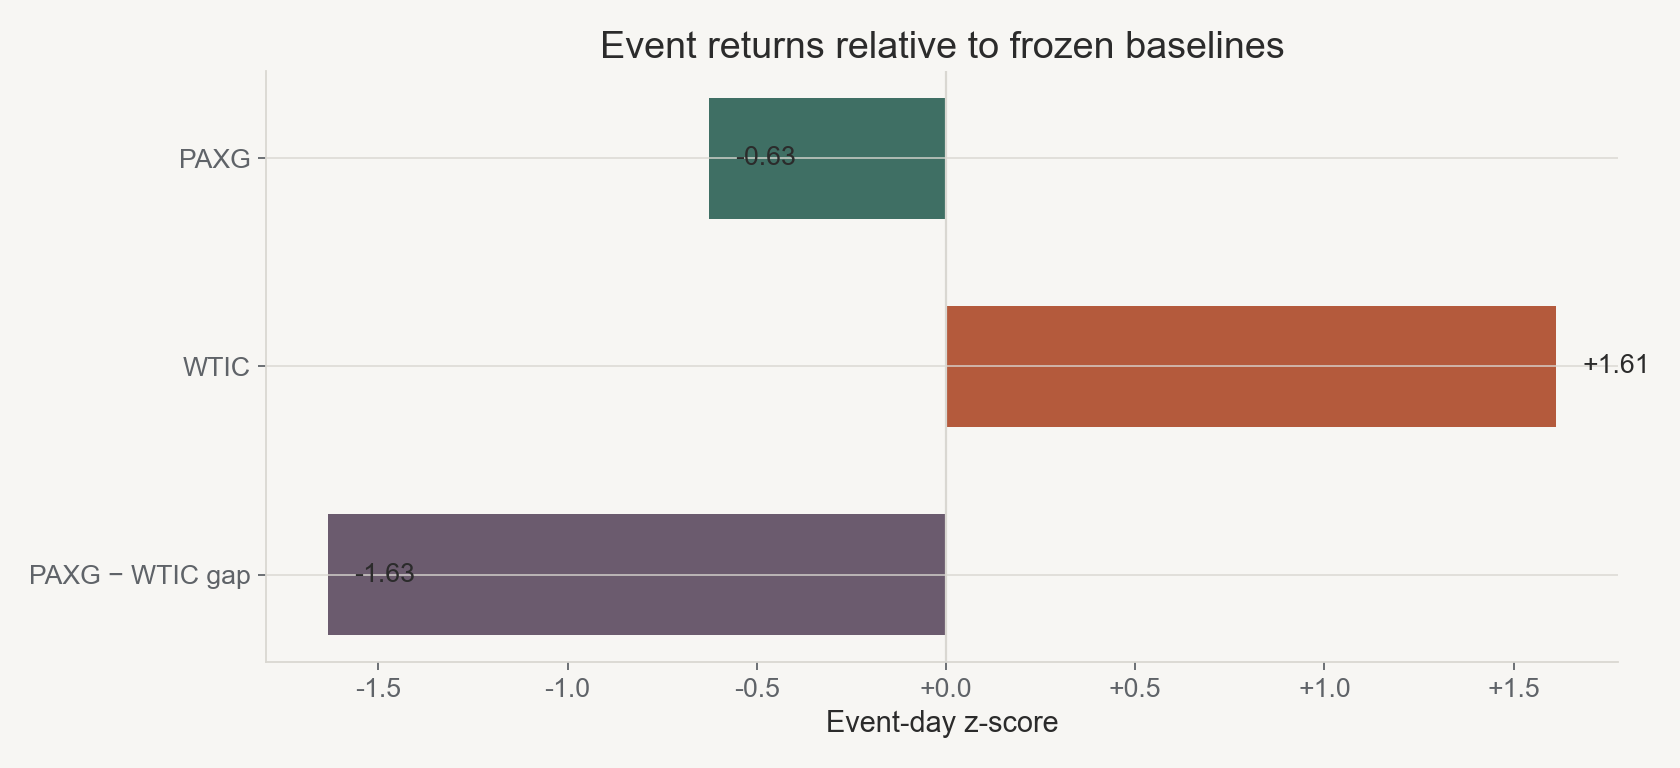
| PAXG | −0.92% | −0.63σ | 90 |
| WTIC | +3.89% | +1.61σ | 48 |
PAXG tracked the negative gold direction, but the move was ordinary against its 90-return baseline. WTIC’s rise was larger against its own 48-return baseline—+1.61 standard deviations.
The benchmark moves were visually clear. The token-level standardized results were more restrained. Those are different claims.
Question 3 — Did the Response Persist?
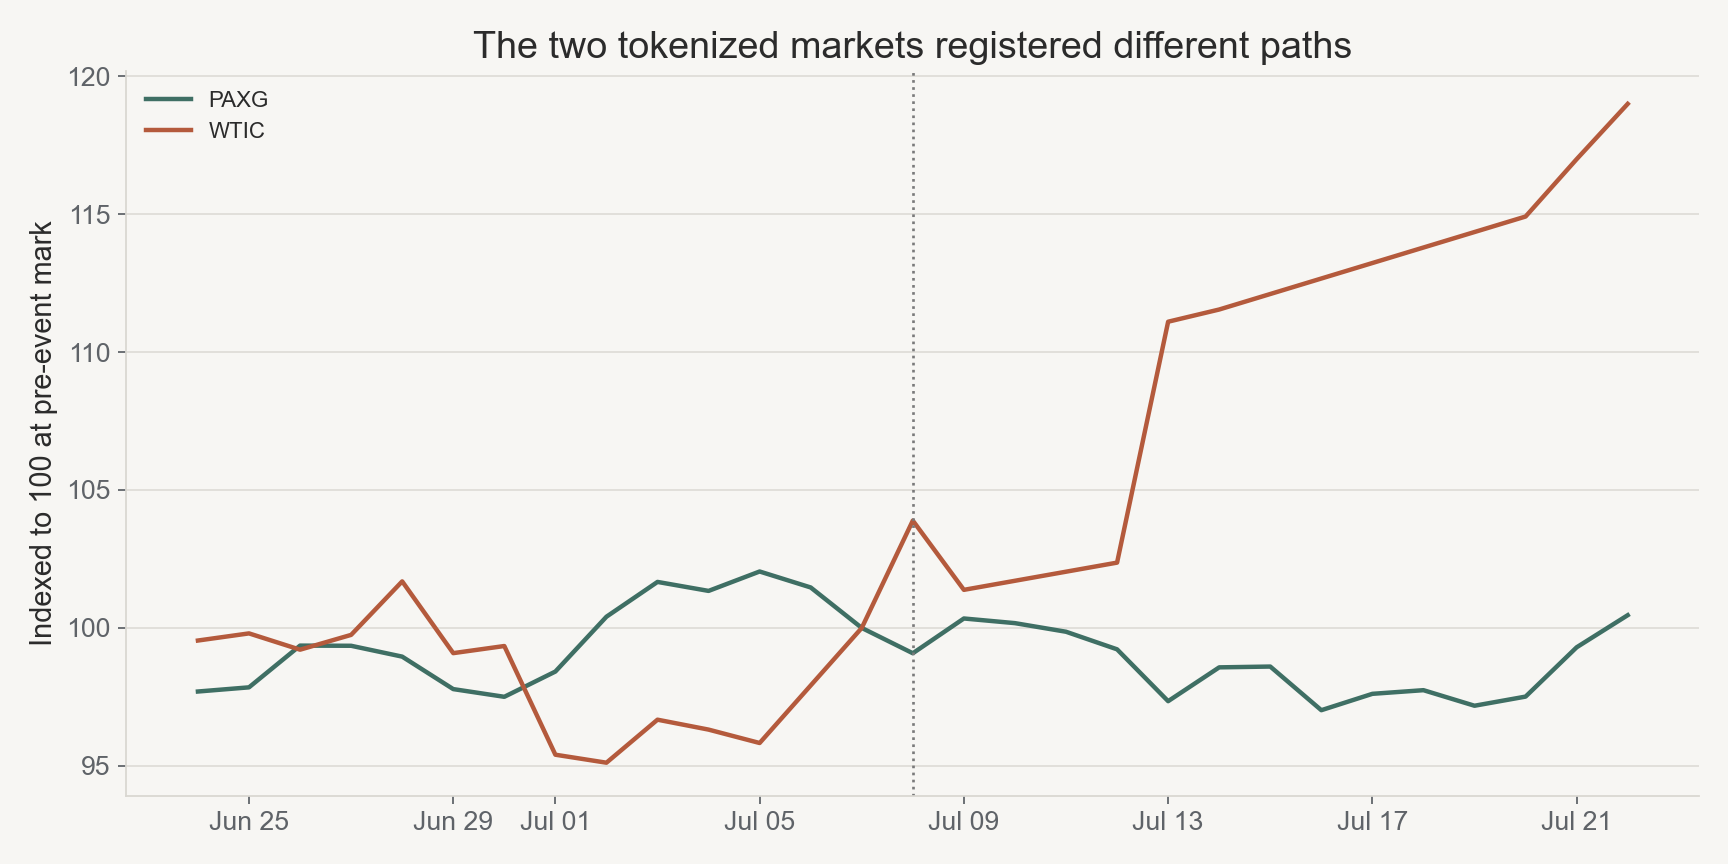
Event-day response and persistence are separate outputs. The shock score uses the event-day return. Horizons stay anchored at the event close and count later priced observations.
| Priced observations after event | PAXG | WTIC |
|---|---|---|
| +1 | +1.27% | −2.42% |
| +3 | +0.79% | +6.94% |
| +5 | −1.75% | +10.61% |
| +20 | −1.14% | unavailable |
PAXG reversed the event-day decline on the next observation, then moved below the event close again by its fifth priced observation. WTIC gave back part of its rise first; its fifth priced observation did not arrive until 20 July, and by then it was 10.61% above the event close.
Question 4 — Did the Token Markets Diverge Unusually?
The last check drops the commodity benchmarks and compares the two token returns directly.
shocktrace measure divergence projects/paxg_wtic_reference_2026_07_08 \
  --asset-a PAXG --asset-b WTIC
| Metric | Value |
|---|---|
| Event gap | −4.8087 pp |
| Matched baseline | 48 return gaps |
| Divergence score | −1.6335 |
Opposite-signed token moves produced a wide raw gap. Against the matched baseline, it was 1.63 standard deviations below the mean—noticeable, but less unusual than the raw contrast suggests.
The Oil Leg Was Thin
WTIC met the case’s eligibility rule, but its public market was narrow:
- one eligible pre-event pool;
- about $3,500 of event-day public-pool volume;
- 23 of 113 surface days below the $100 pricing threshold.
That does not erase the observed response. It limits how strongly I interpret it.
The engine forms a daily return only when adjacent UTC calendar days both have prices; it never relabels a bridged multi-day move as daily. That leaves 48 WTIC baseline returns. Across $0, $50, $100, and $250 thresholds, WTIC stayed at +1.56 to +1.61 standard deviations and the paired divergence at −1.57 to −1.63, so the qualitative result was stable.
WTIC’s claimed one-barrel backing also remains an issuer claim unless a named attestation is attached. The measurement establishes that a token and public pool responded. It does not establish reserve quality or a canonical tokenized-WTI market.
Freeze the Number
Before a number reaches the article, both input classes pass through the same engine output and claim gate.
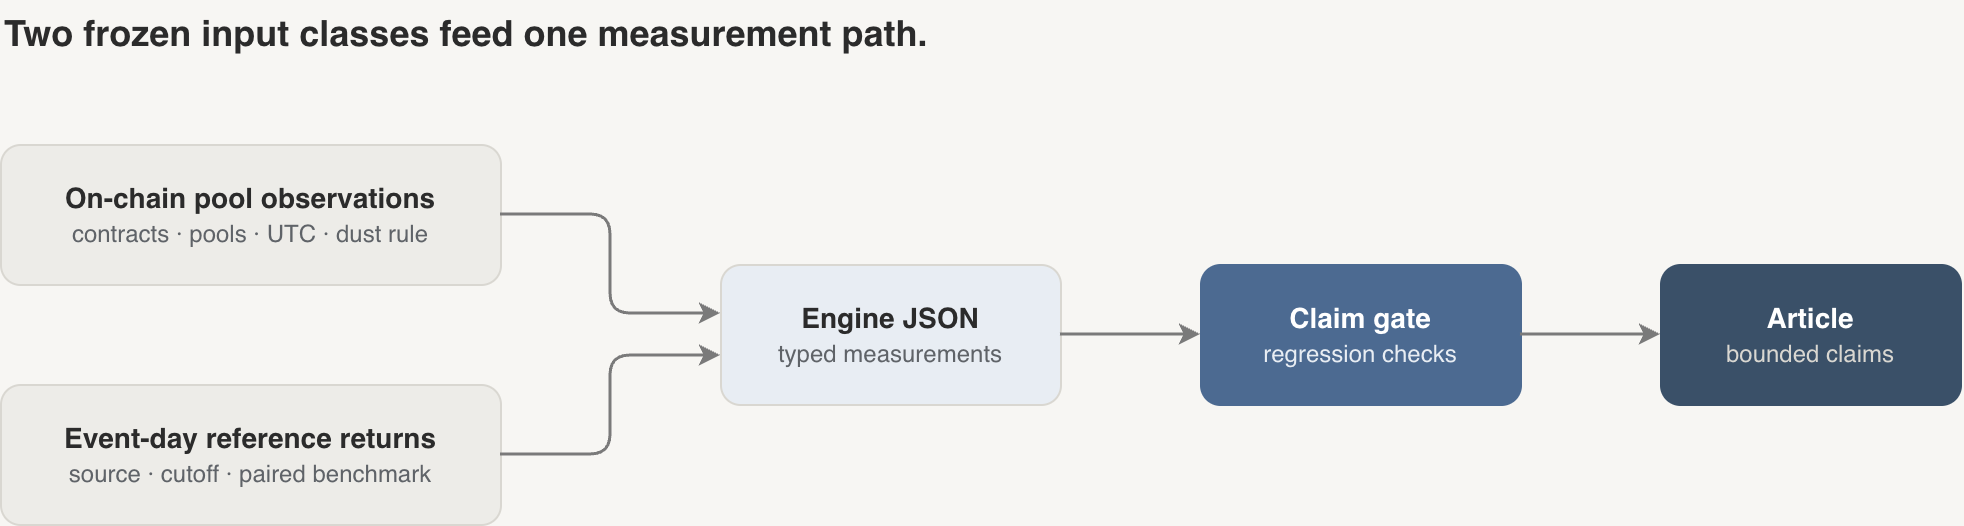
Reference rows retain source and cutoff. The on-chain freeze retains contracts, pool universes, UTC dates, and the dust rule. Regression tests enforce adjacent-day returns, priced-observation horizons, response-gap subtraction, matched-date divergence, and missing values.
Closing
Direction matched on both legs. The standardized sizes and later paths did not.
PAXG’s event-day move was ordinary against its own baseline and reversed quickly. WTIC’s standardized move was larger, although it came from a thin and discontinuous public-pool surface; no linked flow between the two markets was measured.
Shocktrace was not for making a z-score faster. It was for asking the next shock question without changing the accounting underneath it.
The next useful input is a synchronized reference series. Until then, the reference-to-token response gap remains a same-date comparison—useful, but deliberately bounded.