Markets Are Full of Roads. That Doesn't Mean Capital Takes Them.
Five Solana wrappers on one company, one issuer-designated conversion route, and nine weeks of swap-level flow through it. Public data only, no position taken.
I first looked at SpaceX before the listing, when access arrived before the stock. A listing-day follow-up mapped how similar tickers led to different claims and records. This time I follow the on-chain wrappers after the event.
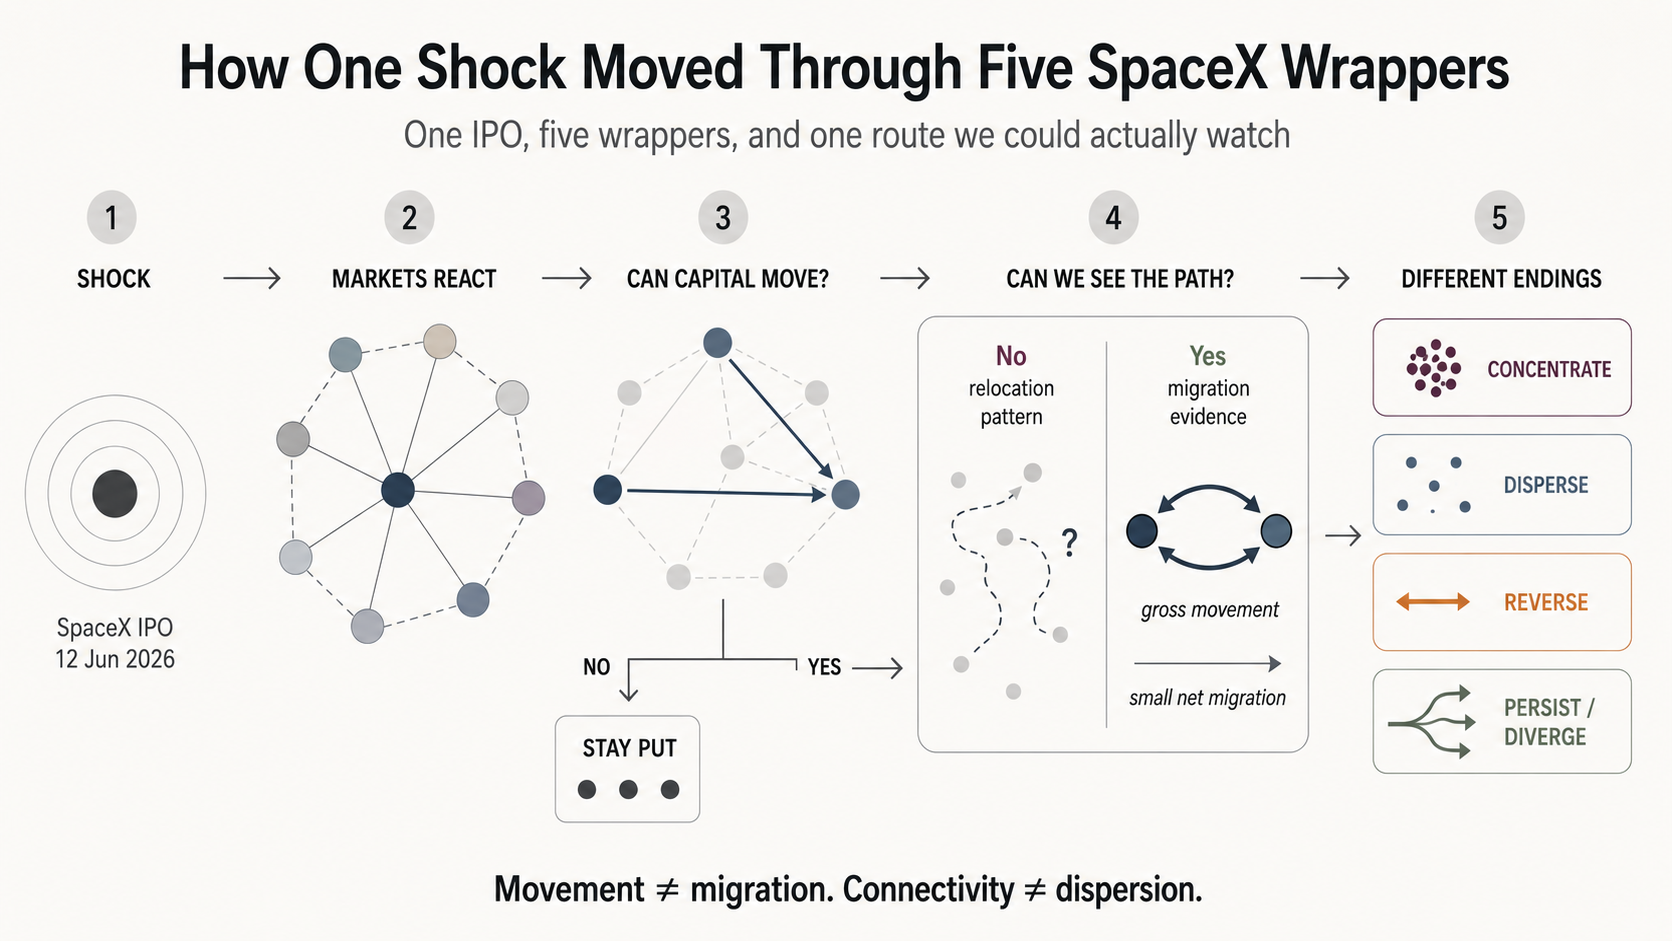
Something large appears in a market. The immediate story is that money moved toward it.
That reflex is common in “record volume” headlines. We can see that one market got quieter and another got busier. Whether the second got busier because of the first is the migration claim, and it is difficult to verify.
Two episodes made me distrust it.
USDC, March 2023. Circle disclosed $3.3bn of reserves stuck at Silicon Valley Bank; USDC traded to roughly $0.88. The next day Curve printed the highest daily volume in its history, about $6.03bn. Read as activity, a record day. Read as liquidity, the opposite: USDT drained toward a single-digit share of the 3pool while USDC and DAI ballooned past 46%. The busiest pool was the exit—and it reversed.
Terra, May 2022. Roughly $50bn of UST and LUNA went to zero in a week. Badev and Watsky, covering 44 blockchains for the Federal Reserve, found the reverse of a walk to safety: chains sharing more bridges with Terra were less likely to gain relative TVL share over the next six weeks, the odds of losing share rising roughly 40% per shared bridge. The bridges worked as transmission channels, not reallocation infrastructure.
What the Evidence Must Show
Reallocation needs a source, a destination, and a path between them. Two markets moving in opposite directions establish only the first two. Without linked transactions, the migration claim remains an inference.
A visible path shows only that reallocation is possible—Terra shows that the same path can carry a shock instead. Volume is not depth either: volume counts events, while depth determines what can be executed. Curve had record volume with a deteriorating pool on the same day. Holder counts can mislead for the same reason; a market can add holders while its book thins.
A Visible Path Through Five Wrappers
On 12 June 2026 SpaceX began trading on Nasdaq—priced at $135, opened at $150, and closed at $160.95. For four months beforehand, claims on the same exposure were already trading on Solana. The plumbing is public: every wrapper is a mint address with issuer-controlled metadata, every swap a transaction. If migration is measurable rather than inferred, it should be measurable here.
It is messier than the ticker suggests. Nine Solana mints carry a SpaceX-like symbol and four are squats—including three named “SpaceX” reporting pool reserves of $454M to $1.25bn against five-figure daily volume. Identifying the substitute set already requires information the ticker does not carry. I froze the canonical-mint list before comparing the post-IPO outcomes; inclusion required issuer-attributable on-chain metadata or issuer documentation, not a volume cutoff.
The five canonical wrappers do not form one market:
SPACEX(PreStocks) is pre-IPO economic exposure through an SPV. The holder can swap intoSPCXxor any other token, but must act before 12 March 2027. Unconverted tokens expire worthless.tSpaceX(Tessera) is a loan participation right, not a security. Redemption waits for the SPV to divest the underlying exposure; the holder cannot trigger it.SPCX(Backpack Securities) represents a real share held 1:1 in regulated custody. The holder can reach the actual share through ACATS/DTCC.SPCXx(Backed) andSPCXon(Ondo) both use issuer primary markets, but access differs sharply. Backed requires KYC and a $5,000 minimum. Ondo starts at $1 and excludes US holders.
On a screen, these are five ways to own SpaceX. In the plumbing, one can expire, one waits on the issuer, one reaches the real share, and two depend on primary-market access.
These differences existed before the IPO. The event made their consequences easier to observe.
The Designated Path Carried 3.5% of Supply
PreStocks names the conversion target itself—SPCXx, by mint address—with a deadline of 12 March 2027, after which unconverted tokens expire worthless. Conversion happens “through normal trading,” so the route is a public swap venue, and a pool for exactly that pair appeared at 16:23 UTC on listing day.
Here the path is visible, and net flow through it was small.
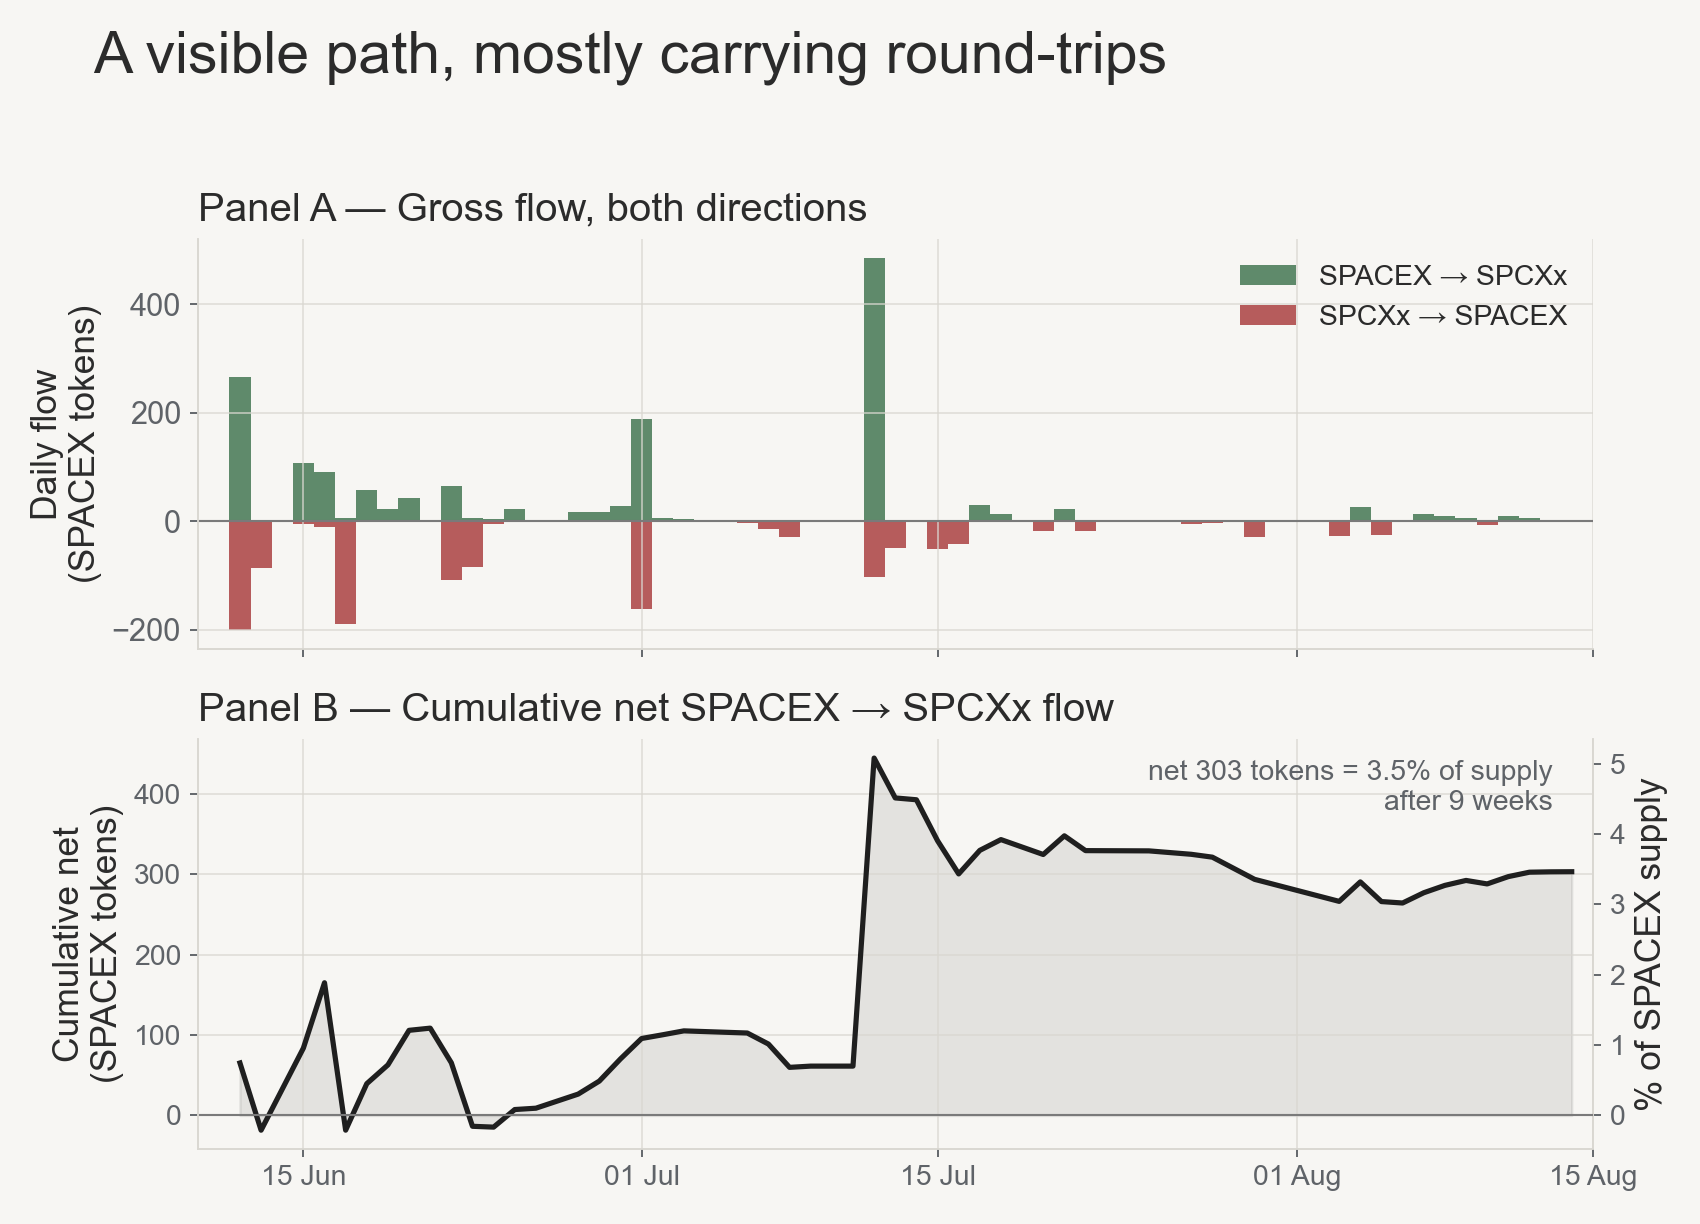
SPACEX↔SPCXx swaps on Solana, matched on the mint pair rather than a single pool, measured on the SPACEX leg in tokens. Panel B cumulates the net over 12 June – 14 August; the right axis expresses it against total SPACEX supply of 8,742.6 tokens. A swap in this pair accomplishes what the conversion terms require, but the pool is not issuer-operated and some flow is ordinary trading or arbitrage. Neither gross nor net flow identifies one-way conversion. Source: Dune dex_solana.trades; mint-pair flow frozen 12 June – 14 August 2026.
Gross flow into SPCXx over nine weeks: 1,586 tokens. Gross flow back: 1,283. Net: 303 tokens, or 3.5% of supply.
Four-fifths of the traffic on the conversion route was offset by flow in the other direction. The cumulative line goes negative on four days, peaks at 5.1% of supply on 12 July, then drifts back to 3.5%. A cumulative total that falls is not a one-way conversion queue; the route also carried two-way trading.
Possible explanation, not verified here: traders may have been trading around the lockup discount. PreStocks discloses that underlying shares unlock in tranches over six months and that the token trades at a market-priced discount until they do. The swaps do not identify trader intent.
Gross volume counts both directions, so I do not treat it as one-way reallocation.
Supply says something separate, and the two numbers should not be netted against each other. SPACEX cumulative net mint-minus-burn was 5,623.03 tokens on 11 June and 5,622.76 on 14 August—−0.27 tokens across the whole post-IPO period. Whatever trading occurred, it was not accompanied by a material contraction in observed net issuance.
That is not the same as “97% unconverted.” Holders were free to swap into anything else, and those exits appear in neither figure. The evidence supports two separate facts: small net flow along the designated path, and almost no change in observed net issuance.
The designated route never carried most of the flow either: SPCXx was 11.3% of all SPACEX selling in the event week, 43.2% during settling, 15.8% recently. The issuer’s “or any other token” is doing real work.
Nor was it where post-IPO trading concentrated. In the event week, Backpack’s SPCX—the only one redeemable into an actual share—traded $23.47M against SPCXx’s $3.28M. That says where activity gathered, not where SPACEX holders went. The two measurements should remain separate.
The IPO Did Not Empty the Neighbourhood
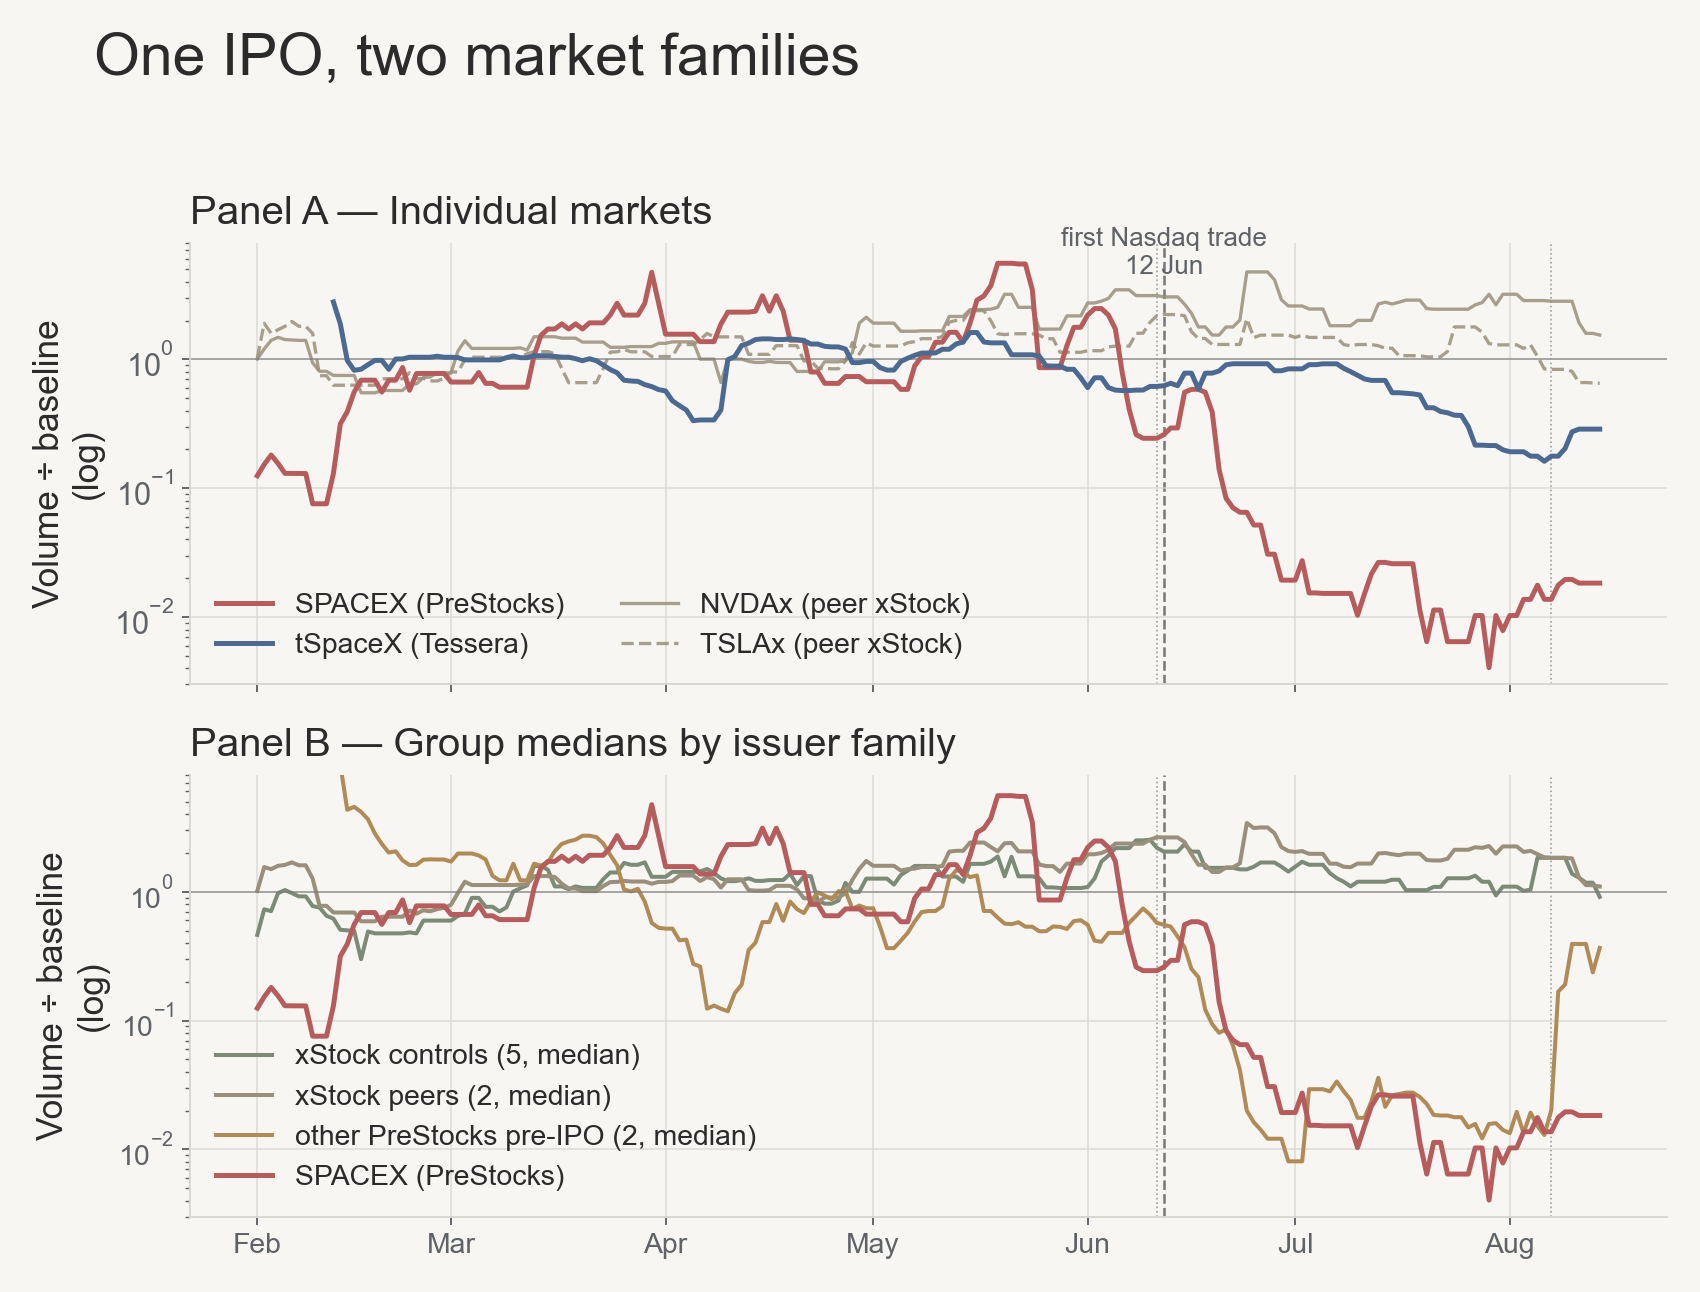
dex_solana.trades, canonical mints only; frozen 1 February – 14 August 2026. Window medians are true medians.
A 3.5% net flow is small but not zero. Did the IPO drain the market around it? SPACEX activity moved in that direction: 1.32× baseline during the anticipation window, 0.47× during IPO week, 0.02× through late June and July, and 0.01× by August.
The control group breaks that explanation. Anthropic’s and xAI’s pre-IPO tokens—companies that did not go public—fell to 0.02× over the same windows, closely enough that Panel B shows two lines on top of each other. Five Backed xStocks held as controls finished at 1.10× baseline; the two xStock peers at 1.69×.
Note: SPYx reached 12.6× baseline in the event week, against a control median of 1.6×. A broad-index reaction to the IPO is plausible but not verified. The group result uses the median, so this observation does not determine it.
In this sample, the split followed issuer families more closely than exposure to SpaceX. One issuer’s product line went quiet; tokenized equities on the same chain, venues, and token standard did not. The data do not identify why PreStocks went quiet.
Possible explanation, not verified here: one possibility is an issuer-level liquidity or distribution shock—for example, a market maker reducing inventory across several PreStocks products. I do not have historical LP attribution or issuer-side traffic data to test that mechanism.
The timing also disagrees with an immediate IPO effect. SPACEX was still above half its baseline during listing week; the larger decline came later. The untied wrapper followed another path: tSpaceX held 0.80× through the settling window, a 40× gap against SPACEX, and only fell to 0.22× five weeks later.
A mechanism in which the SpaceX listing emptied its own substitutes cannot explain why Anthropic’s pre-IPO token died at the same rate on the same schedule.
What the Wrapper Terms Allowed
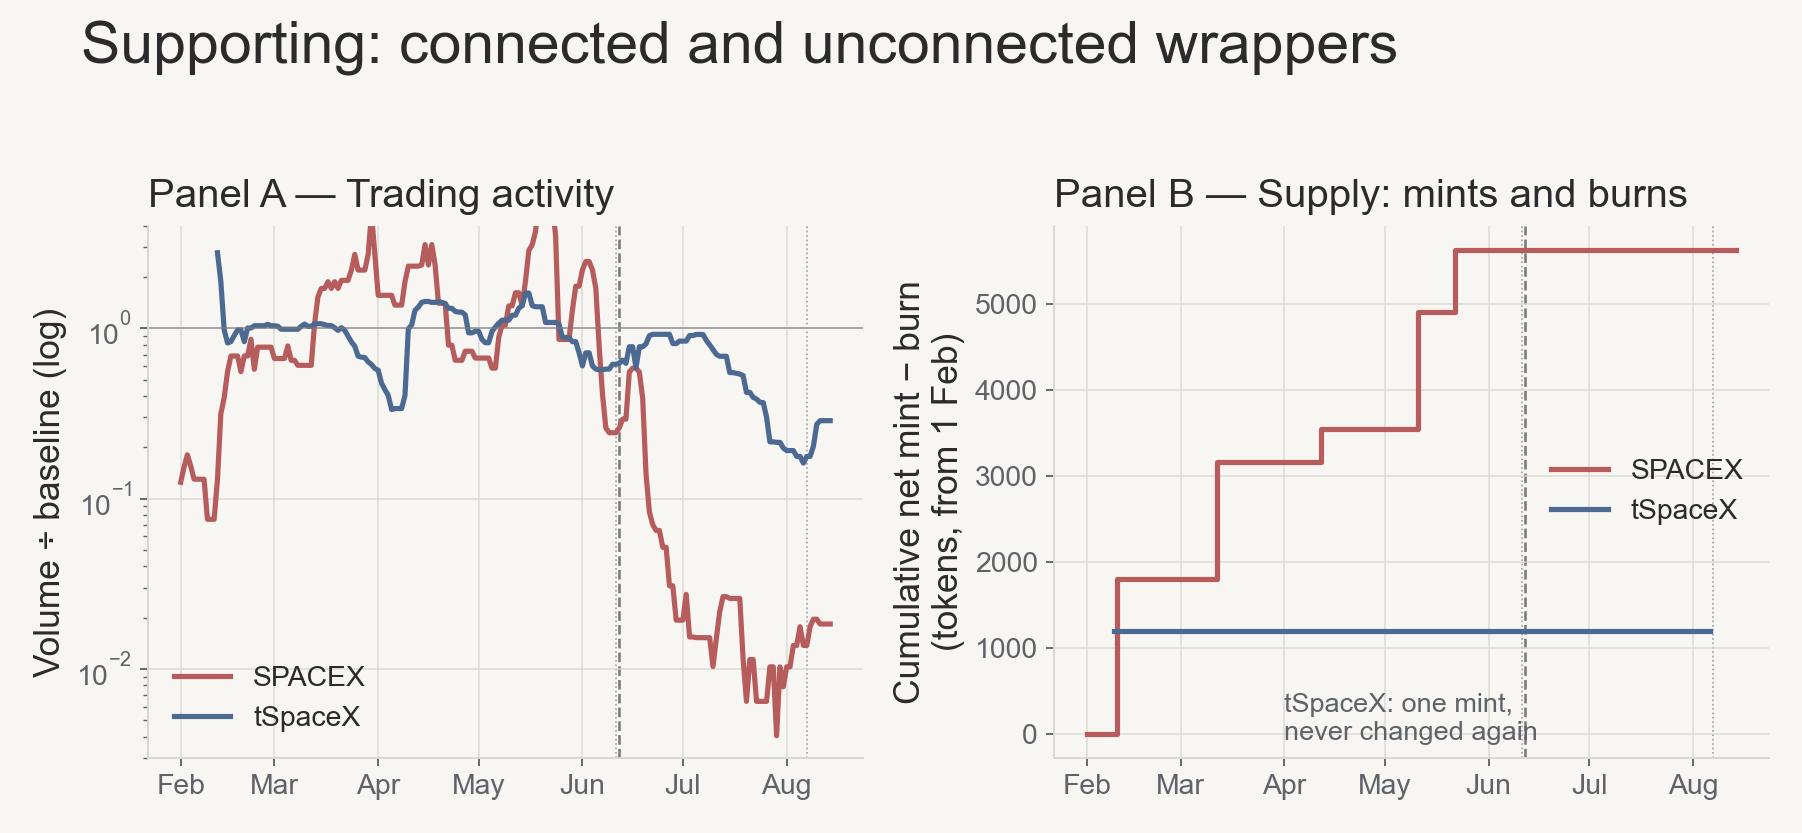
The cleanest fact in the exercise is the flat blue line. tSpaceX was minted once, 1,190.0000 tokens on 9 February, and stood at 1,189.9971 on 14 August—a decline of 0.003 tokens, or 0.0002%, spread across about two dozen dust-sized burns. No redemption of any economic size occurred, straight through the SpaceX IPO.
That is consistent with the architecture. Tessera’s on-chain metadata describes a loan participation right held through a Cayman segregated portfolio, with redemption triggered by “divestment of the underlying exposure.” The holder cannot initiate it. No divestment occurred, so no redemption occurred—the routes that were available and the routes that were used are the same set.
The terms tell us which exits holders could initiate, but they cannot by themselves explain why SPACEX and tSpaceX later traded differently; issuer and liquidity-provider effects remain mixed together.
The difference is not only legal. I recorded Jupiter quotes for four of the five wrappers every half hour for a week—311 captures—at $1,000, $10,000 and $50,000, in both directions. SPCXon is absent because its mint could not be confirmed against issuer-controlled metadata, so it never entered the frozen universe. At $50,000 the quoted buy impact ran from 14 bps on SPCX to 4,664 bps on SPACEX: a 300-fold range across four claims on one company.
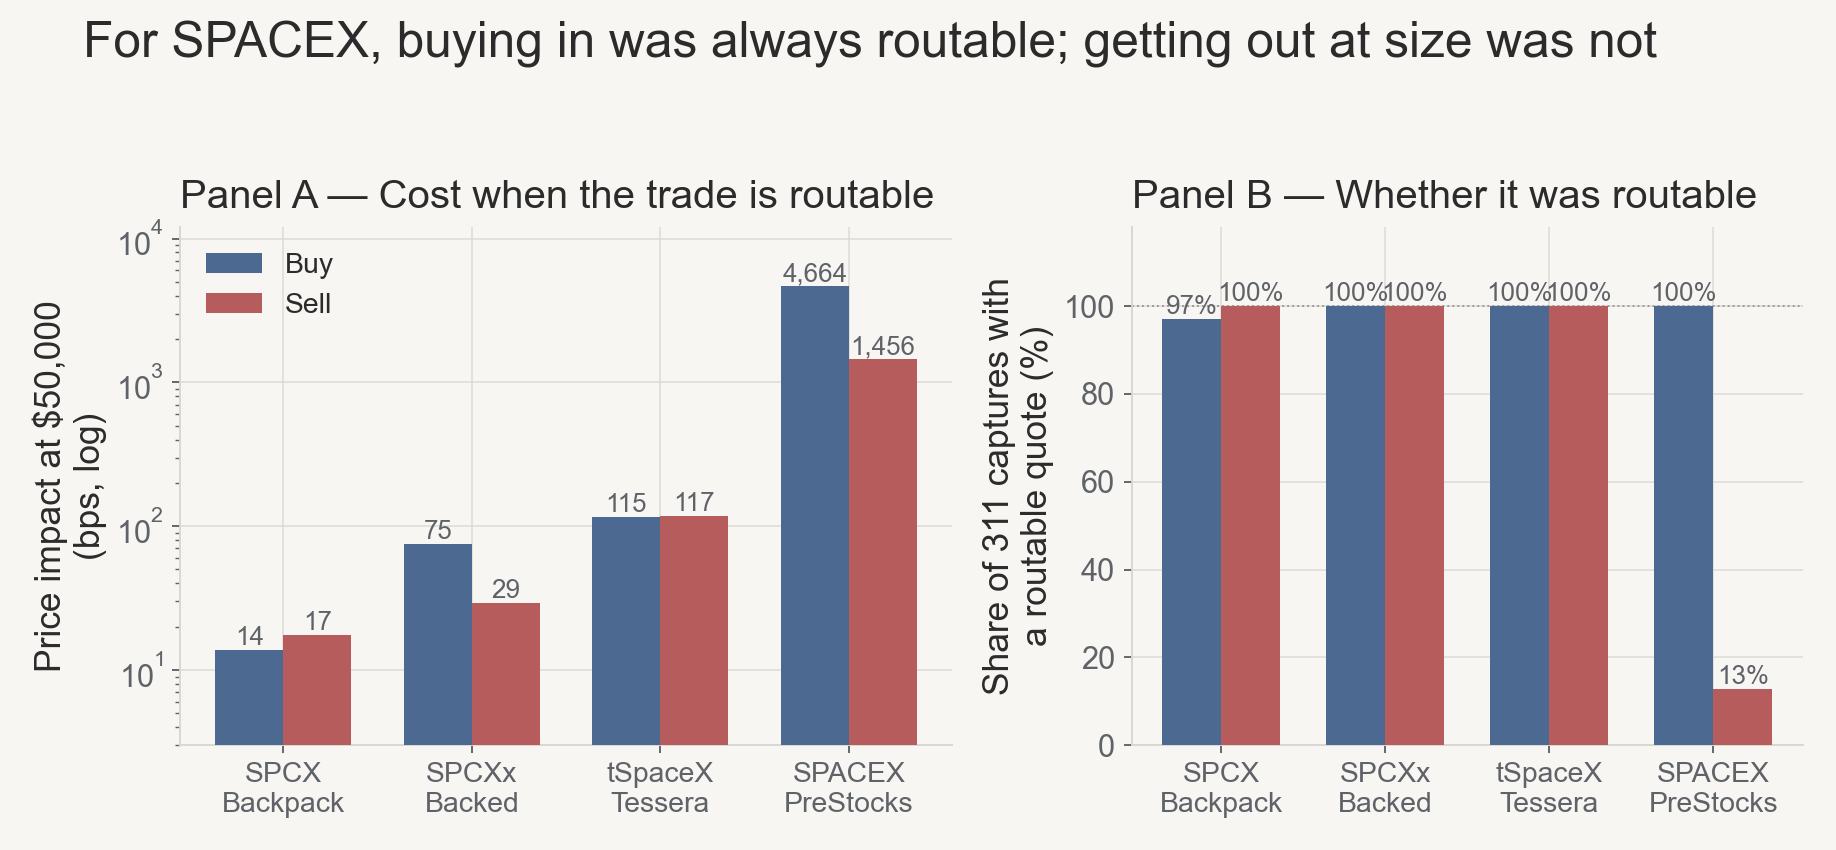
SPACEX's sell bar in Panel A looks cheaper than its buy bar only because it is measured on the 13% of captures where the sell was possible at all. Quoted depth, not executed trades.
| Wrapper | Issuer | $10k buy | $50k buy | $50k sell |
|---|---|---|---|---|
SPCX |
Backpack Securities | 5 bps | 14 bps | 17 bps |
SPCXx |
Backed | 18 bps | 75 bps | 29 bps |
tSpaceX |
Tessera | 21 bps | 115 bps | 117 bps |
SPACEX |
PreStocks | 788 bps | 4,664 bps | 1,456 bps, routable in 13% of captures |
Jupiter returned a routable $50,000 buy quote for SPACEX in every one of the 311 captures. It returned a routable $50,000 sell quote in 13% of them, and returned none for a $10,000 sell in 19% of them. A quote to buy into the expiring wrapper was always available; a quote to get out at size usually was not.
That asymmetry is the part a single-direction measurement hides, and it matters here more than the headline basis points, because the trade this wrapper’s holders face before March 2027 is the sell. The three wrappers with a working exit route quote both directions at comparable cost. The one with a deadline does not.
(These quotes are the 7–14 August book; historical quotes cannot be reconstructed.)
Where the Evidence Stops
The route was visible, sanctioned by the issuer, and open on a public venue for nine weeks. Net flow through it remained small, and observed net issuance barely changed. Meanwhile, wrappers with no IPO also lost activity. These observations do not support a simple migration story; they do not identify the mechanism behind the wider decline.
The public trail stops in three places.
- Depth during the event. Jupiter quotes are live-only, so historical executable depth cannot be reconstructed after the fact. The charts measure activity, participation, or supply. The basis-point comparison is the 7–14 August book, not the June book; that week was recorded prospectively for exactly this reason, and the recording continues for the next event.
- Activity outside Solana DEXs.
SPCXxalso trades on Kraken and Bybit; Backpack’s token trades on its own exchange. The direction of the resulting coverage bias is unknown. - Why PreStocks went quiet. The control group isolates the mismatch. It does not explain it.
The window is also incomplete. tSpaceX was still falling in the last interval, and net flow on the designated route was still drifting down in August.
Closing
These wrappers were easier to put on one screen than to treat as one market. They differed in who could redeem, what redemption delivered, when it could happen, what a fixed-size trade cost—and whether it could be routed at all. The issuer-designated pair made one exit visible, but most of its gross flow was offset in the other direction.
A route tells us what holders can do, not what they did. If one market loses activity while another gains it, I would call that an activity shift until transactions connect the source to the destination.
Appendix: Sources
- Market data: Dune
dex_solana.tradesandtokens_solana.transfers; live Jupiter quotes captured every ~32 minutes from 7–14 August 2026 (311 captures). The data-processing Gist contains the frozen universe configuration, Dune SQL, the depth collector, the transformation scripts, and the processed CSVs behind every figure. Plotting code is not included. - Wrapper terms: PreStocks, Tessera
tSpaceXmetadata, and Backpack onSPCX. - SpaceX IPO: CoinDesk and CNBC.
- Comparison cases: Federal Reserve, Interconnected DeFi: Ripple Effects from the Terra Collapse; CoinDesk, Curve’s $500M stablecoin pool hammered as traders flee USDC.