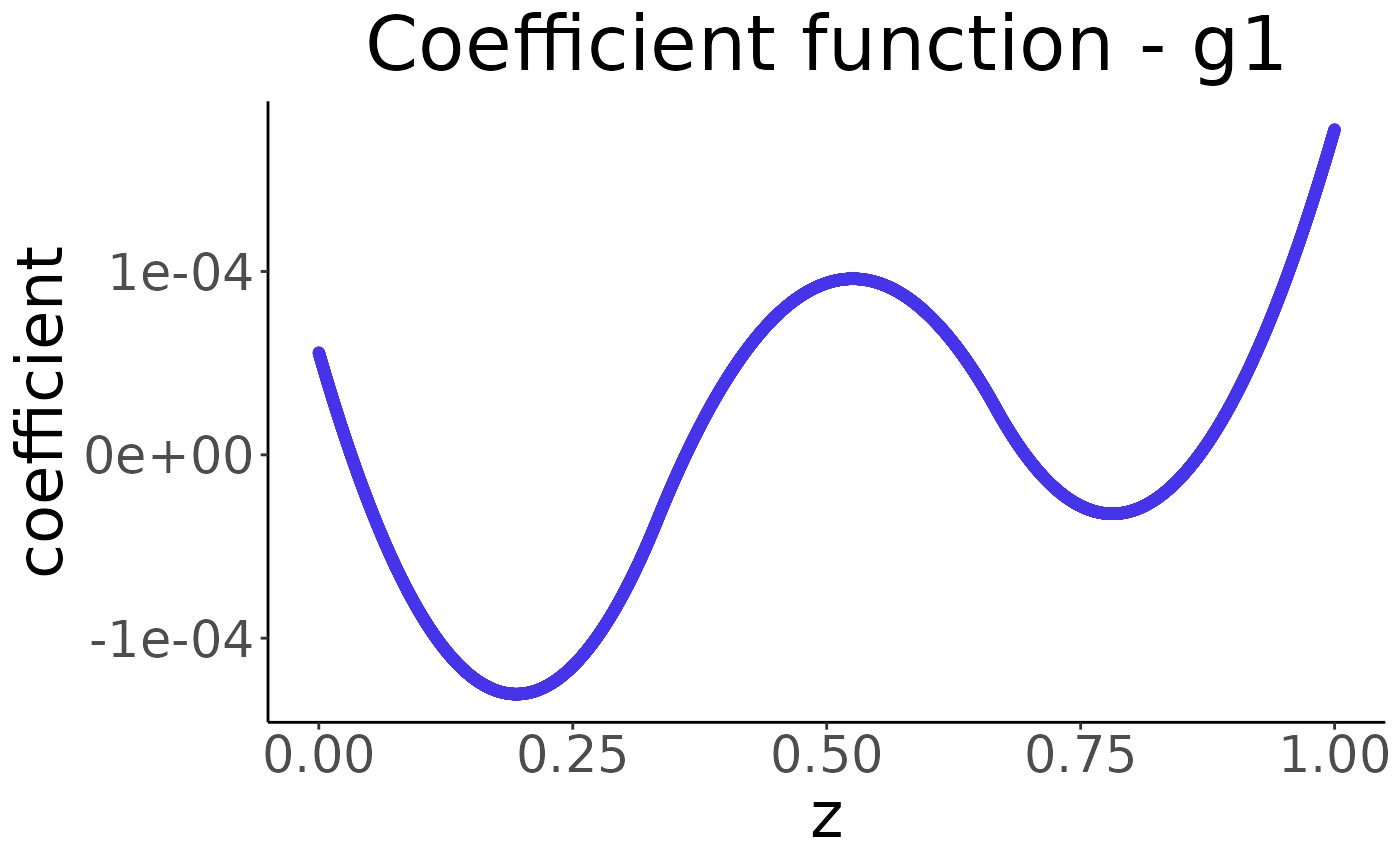
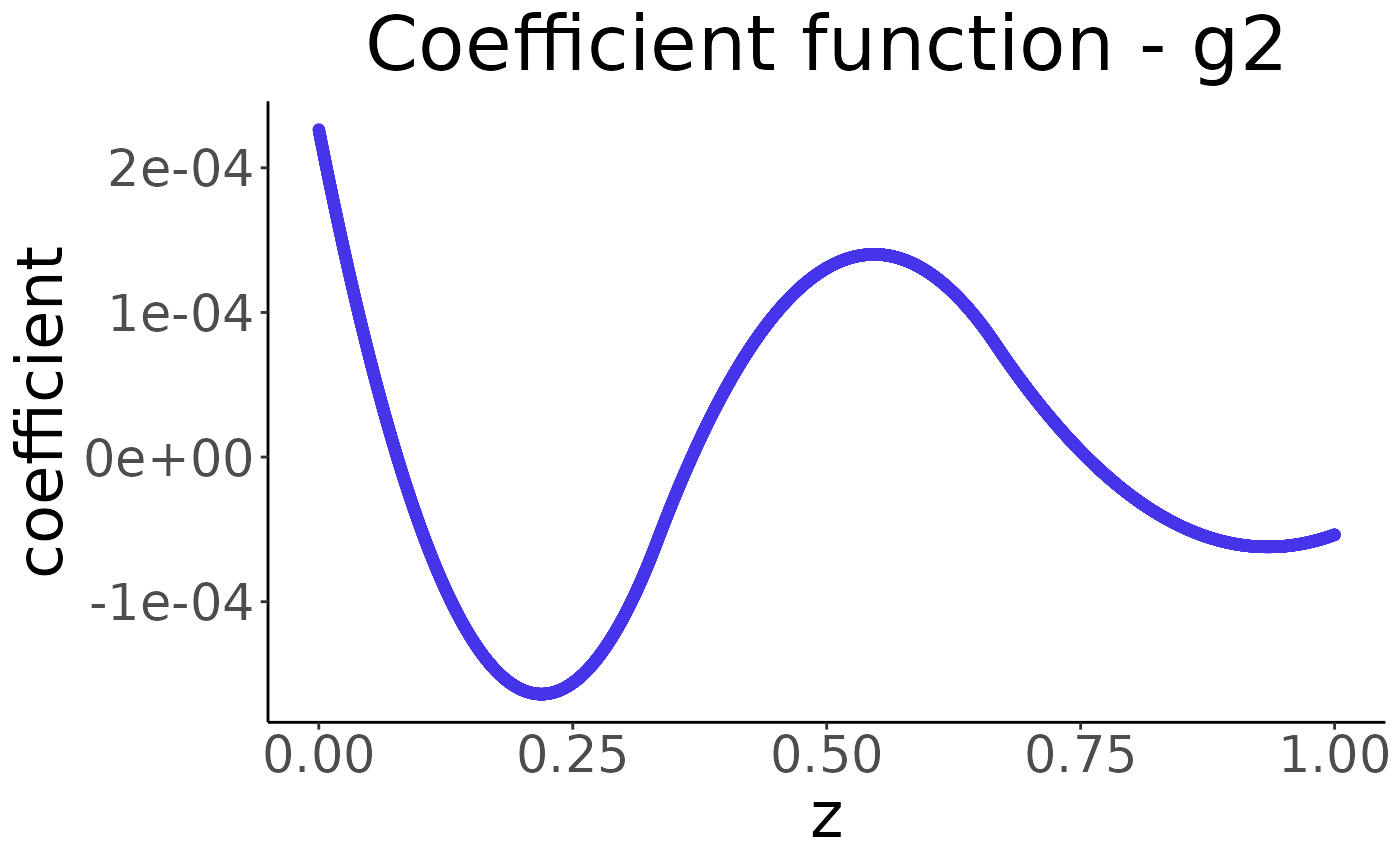
Visualize the predicted coefficient functions selected by BIC.
# S3 method for class 'qrglasso.predict'
plot(x, ...)
Arguments
Value
NULL
See also
Examples
set.seed(123)
n <- 100
p <- 5
L <- 5
Y <- matrix(rnorm(n), n, 1)
W <- matrix(rnorm(n * p * (L - 1)), n, p * (L - 1))

# Call qrglasso with default parameters
result <- qrglasso(Y = Y, W = W, p = p)
#> All values of gamma are zeros when lambda > 2.223
#>

# Predict the top-k coefficient functions
estimate <- predict(result, top_k = 2)

# Display the predicted coefficient functions
plot(estimate)

