Building a Stablecoin Audit Toolkit Around Evidence, Not Dashboards
A Rust-based pipeline for turning stablecoin transfer checks into artifacts, manifests, and an inspectable evidence console.
From stablecoin analysis to audit tooling
This is the fourth post in a stablecoin rail series. The first three posts narrowed the problem from per-chain USDC transfer and supply signals, to local-currency stablecoins and USDC-paired liquidity, to the broader stablecoin dependency map.
The common thread was the same: stablecoin analysis needed to become reproducible evidence, not just a readable chart.
A notebook can explain one result, but it is weak evidence after the fact. The next reader needs the asset, deployment, block window, checks, logs, artifacts, and claim boundary in one place.
The mistake I wanted to avoid is simple: a chart can make transfer count look like adoption. But a high-count window may be exchange inventory movement, bridge-related movement, low-fee churn, or a contract-specific accounting pattern. Without the asset, deployment, block window, decode rule, and claim boundary, the number is too easy to replay as a stronger conclusion than the evidence supports.
stablecoin-audit is my attempt to turn that workflow into a reproducible Rust toolkit.
The v0 scope is intentionally narrow: ERC-20 Transfer reconstruction, zero-address mint/burn-style aggregation, totalSupply boundary snapshots, supply invariant checks, and an artifact manifest with checksums and claim boundaries. It does not measure reserves, peg stability, redemption capacity, bridge backing, geography, identity, swap routing, liquidity depth, issuer intent, or consolidated cross-chain supply.
When a gate passes, it means the accounting identity passed for that asset, deployment, decode rule, and block window. It is not a reserve opinion or a stablecoin safety score.
The screenshots use a deliberately small demo run: USDC / ethereum / blocks 24000000-24001000 / demo_001. The point is to show the audit trail, not to claim the sample is representative.
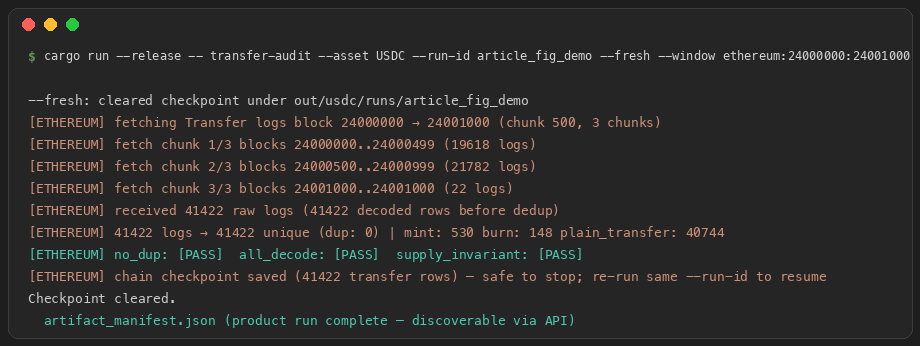
transfer-audit run writes artifacts and artifact_manifest.json.
Why dashboard-first was the wrong boundary
The first temptation was to build a dashboard: a run list, a PASS card, some artifacts, and a download button. That is the obvious product surface. It is also the wrong source of truth.
Once the UI owns the language, every card becomes a place where evidence can silently turn into a claim. PASS must mean a specific accounting gate. Unsupported scope must come from the artifacts, not from a helpful sentence in React. The UI should display the claim boundary, not invent it.
Manifest-centered architecture
The core product object is not the React view or the API route. It is artifact_manifest.json. The CLI can leave many files on disk, but a run becomes a product run only after the manifest exists.
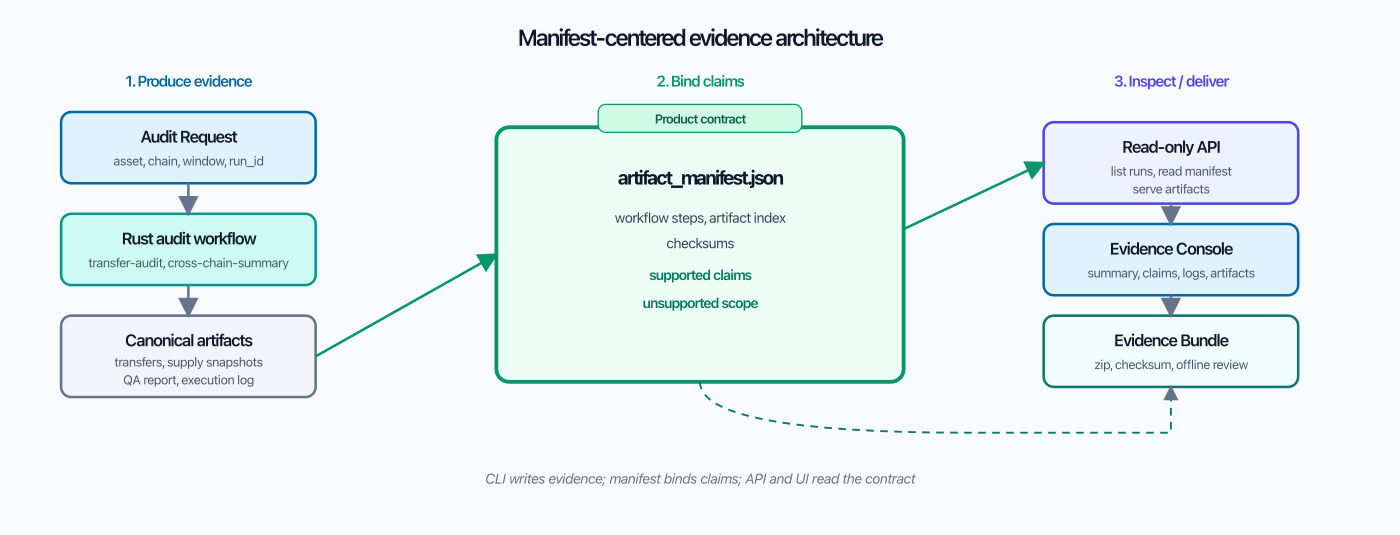
artifact_manifest.json binds claim boundaries, and the API/UI display that contract without creating new audit claims.
The manifest indexes artifacts, records workflow steps and checksums, and attaches supported and unsupported claims. The API and UI read that contract instead of rediscovering meaning from filenames or recomputing audit gates.
A partial run may leave CSV or JSON files on disk. Without a valid manifest, it should not appear in /api/runs, should not be packageable, and should not be rendered as a completed audit.
Rust interface as product contract
The real code lives in src/artifact/manifest.rs. The shape is simple enough to explain without a full schema dump:
pub struct ArtifactManifest {
    pub schema: String,
    pub toolkit_version: String,
    pub command: String,
    pub run_id: Option<String>,
    pub asset: Option<String>,
    pub artifacts: Vec<ArtifactRef>,
    pub source_snapshots: Vec<SourceSnapshot>,
    pub supported_claims: Vec<ClaimBoundary>,
    pub unsupported_claims: Vec<ClaimBoundary>,
    pub warnings: Vec<String>,
    pub workflow_steps: Vec<WorkflowStep>,
}
Claims are not UI copy. They are structured records with evidence paths:
pub struct ClaimBoundary {
    pub claim: String,
    pub status: ClaimStatus,
    pub statement: String,
    pub evidence_artifacts: Vec<String>,
    pub limitations: Vec<String>,
    pub warnings: Vec<String>,
}

pub enum ClaimStatus {
    Supported,
    Unsupported,
    Conditional,
}
The writer validates that claim evidence points to artifacts listed in the manifest. That rule is more important than the field names. Supported scope and unsupported scope stay centralized, and the UI has less room to improvise.
Interfaces: CLI, API, UI
The CLI runs the workflow with local RPC credentials:
cargo run -- transfer-audit --asset USDC --run-id demo_001 \
  --window ethereum:24000000:24001000
It fetches logs in chunks, checkpoints progress, resumes after ordinary failures, and writes artifacts plus artifact_manifest.json at the end.
The API is read-oriented. It lists manifest-backed runs, serves manifest-listed artifacts, and builds or verifies an Evidence Bundle from the manifest. An Evidence Bundle is a portable zip of the manifest, canonical artifacts, logs, and checksums for offline review. GET routes do not call RPC or recompute gates.
The UI starts with the run summary and claim boundaries. Logs and raw artifacts are available, but secondary. Local run execution is developer mode; hosted live execution is a separate product and security problem.
Demo: local audit journey
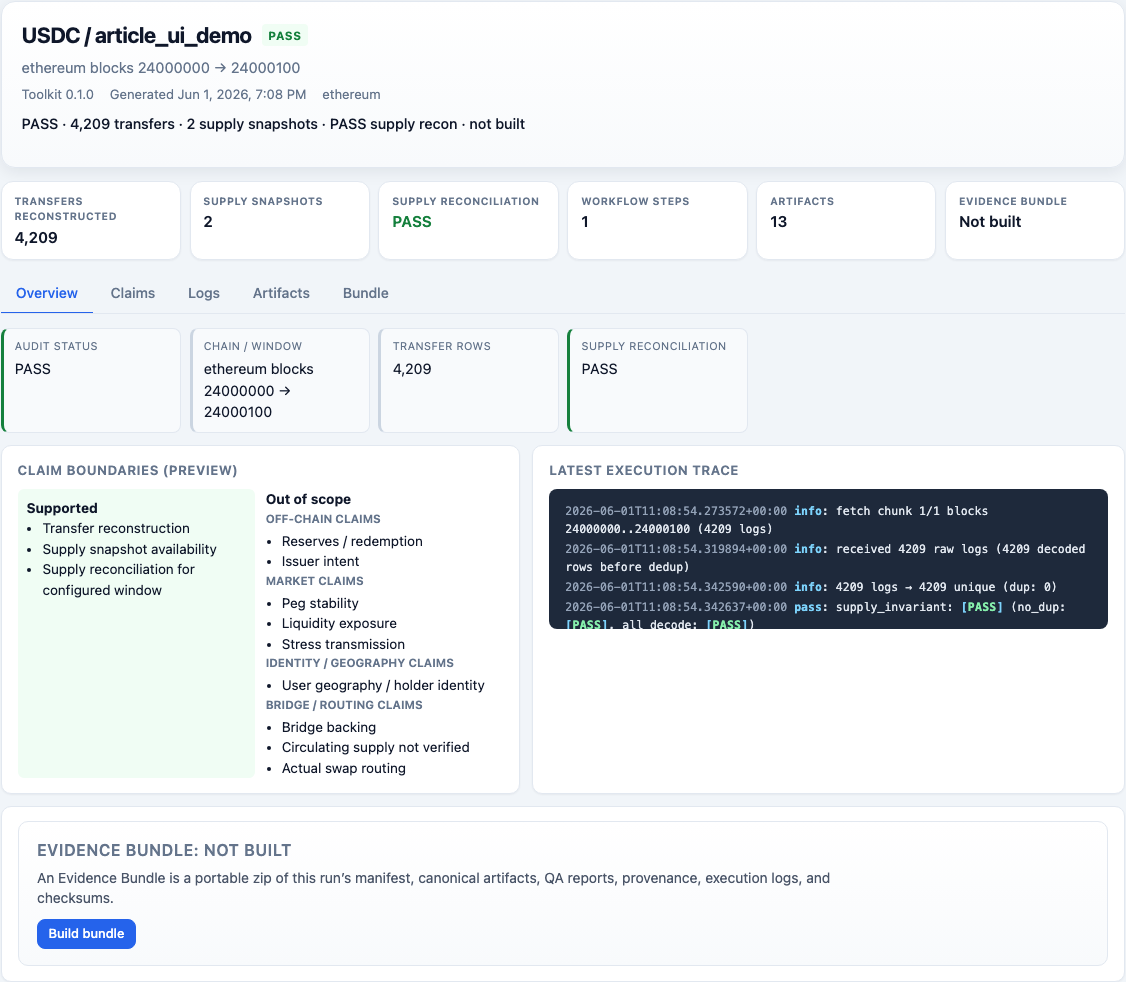
The local flow is short: select asset, chain, and block window; run locally; stream progress and logs; inspect claim boundaries; package the artifacts.
The Evidence Console is intentionally restrained. It should not turn a scoped accounting check into a reserve, peg, liquidity, or risk score.
Engineering notes
Robustness. RPC windows fail for ordinary reasons: rate limits, provider errors, restarts, decode issues. The toolkit uses chunked eth_getLogs, retries, checkpoints, and resume behavior. The manifest is the completion gate.
Scale. The work unit is a deployment and block window. Scale means adding windows and deployments, then rolling up comparable artifacts. It does not mean pretending chains share one block height or that per-chain totalSupply equals global circulating supply.
Latency. The slow path is RPC and log decoding. The UI streams progress and logs because the audit is not instant. Completed artifacts can be served read-only.
Deployment boundary. Safe v0 deployment is local or CI execution followed by read-only evidence serving. Hosted live execution would need authentication, tenant isolation, quotas, RPC key policy, cancellation, rate limits, and abuse controls.
Future engines should follow the same rule. Bridge collateral, liquidity depth, reserve attestations, and swap routing need their own artifacts and claim boundaries, not dashboard labels on top of transfer-audit.
Closing
A passing v0 run gives a reproducible accounting-layer evidence bundle: transfer reconstruction, supply snapshots, reconciliation checks, provenance, logs, and a manifest.
It does not certify reserve adequacy, peg stability, redemption capacity, bridge backing, geography, routing, liquidity, or issuer intent.
The product is not the dashboard. The product is the audit trail.
Code and docs: github.com/egpivo/stablecoin-audit.