Local Pegs, Dollar Rails: Auditing XSGD and EURC Liquidity
XSGD is SGD-denominated. EURC is EUR-denominated. Their observed DEX liquidity surfaces remain materially USDC-paired.
This follows my previous post, USDC Shows Why Stablecoin Risk Analysis Is Not One Signal: separate the accounting signal from the token label, then ask where liquidity sits.
Stablecoins are usually classified by peg: USD, EUR, SGD, gold, crypto collateral. That is useful, but incomplete.
If a token is SGD- or EUR-denominated, does it have a local-currency liquidity rail on-chain—or is its observed DEX liquidity still mediated by USDC?
For XSGD and EURC in this snapshot, the answer is mostly the latter. The tokens are local-currency instruments. Their observed DEX liquidity is still materially USDC-linked.
1. What I measured
I separated three checks that are easy to collapse into one label:
- Accounting floor. Does the ERC-20 ledger reconcile? (
totalSupply(end) − totalSupply(start−1) = mints − burns) - Surface thickness. How many
Transferand mint/burn events are there to inspect? - Liquidity counterpart. What does the token trade against in observed DEX pools?
These checks can disagree. XSGD on Polygon passes the accounting floor in this window, but its observed DEX liquidity is essentially all USDC-paired. The peg label alone does not show that split.
2. Local peg, dollar-mediated liquidity
EURC and XSGD run the same accounting schema as USDC. Six of seven asset-chain pairs pass the supply invariant in the canonical window; full transfer counts, mint/burn totals, gross-to-net ratios, and invariant status are in the canonical window audit panel. The exception—USDC Arbitrum—is a schema gap: bridge gateway mints do not register under the zero-address convention. That is an audit-schema limitation, not evidence of token insolvency or ledger failure.
EURC and XSGD pass the accounting floor. Where they diverge from USDC is the liquidity surface.
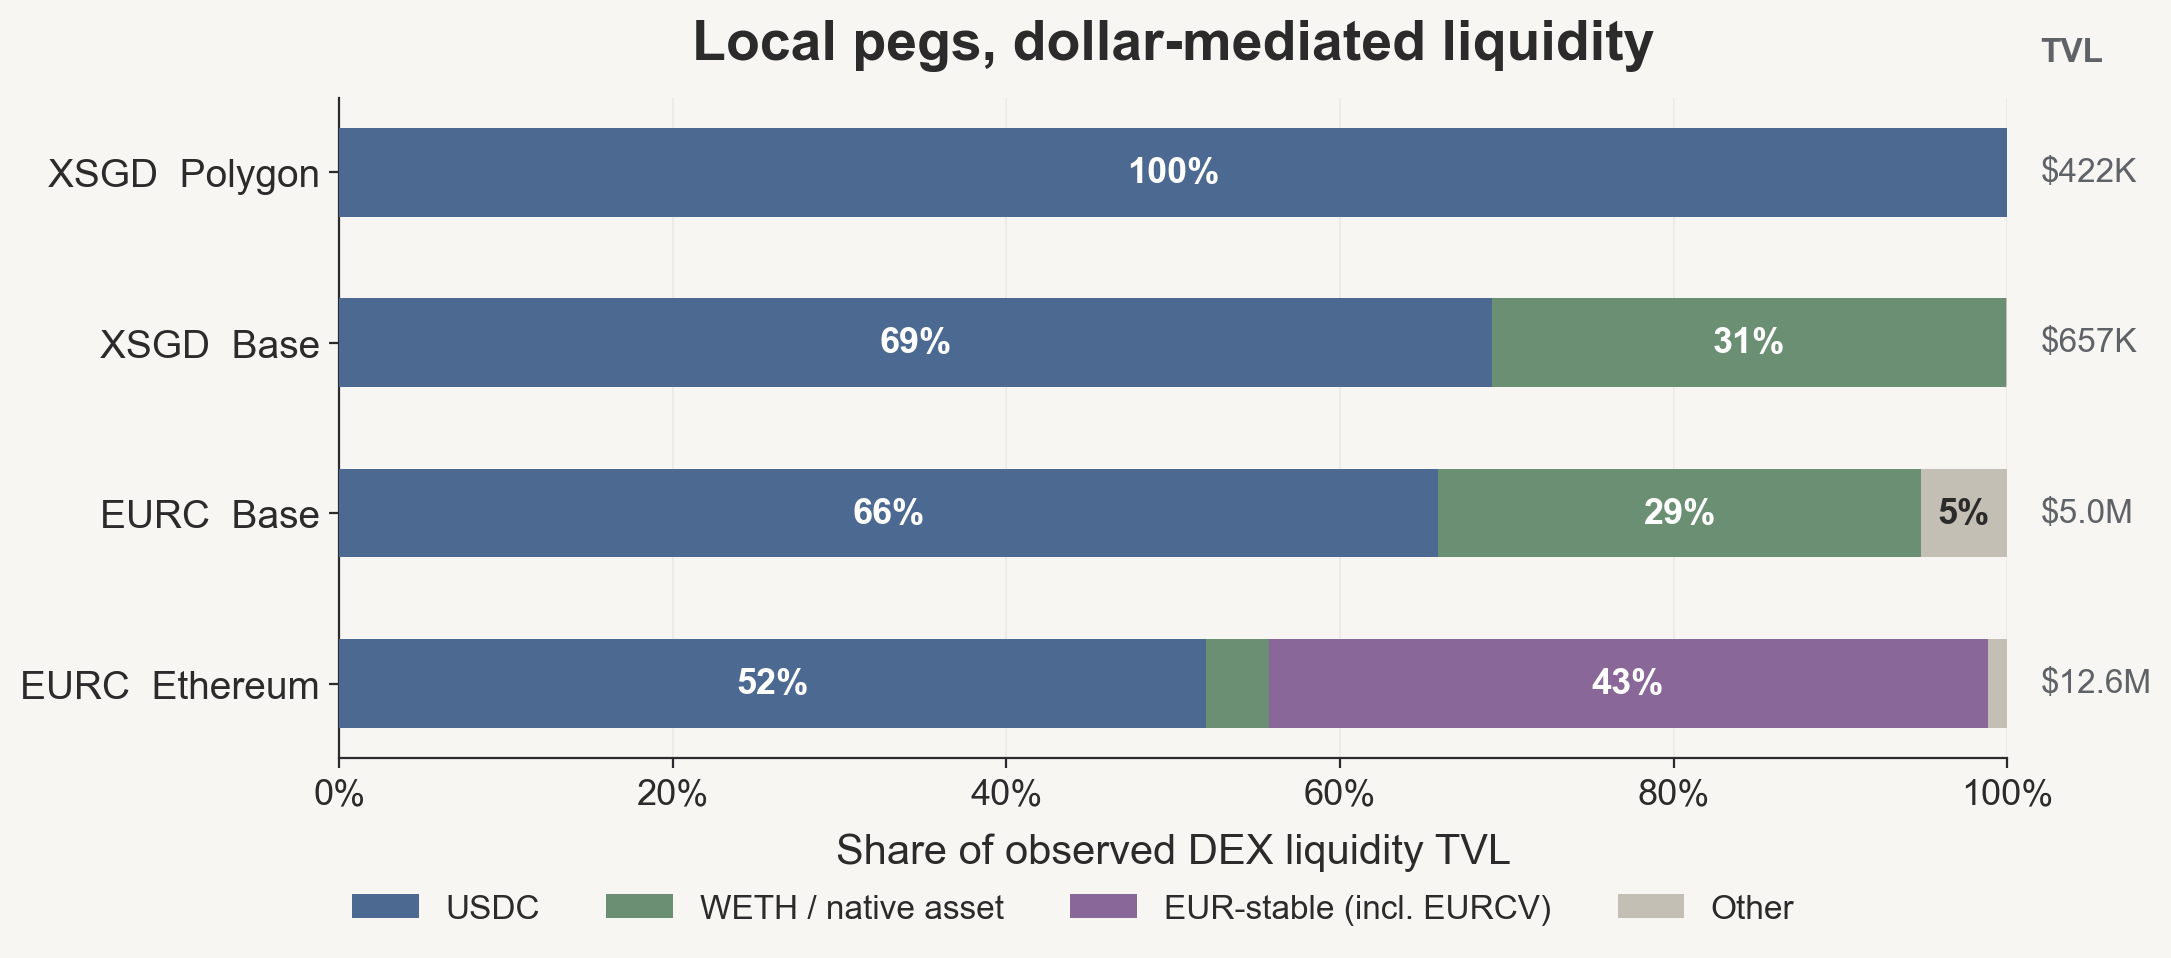
The important point is not that every local-currency token is dollar-backed. It is narrower: in this observed DEX surface, exit liquidity is mostly organized around USDC. EURC Ethereum is the partial exception, but even there USDC is the largest single counterpart class. Its EUR-stable share also includes EURCV, a Morpho MetaMorpho yield vault wrapping EURC deposits; excluding EURCV, the EUR-stable share drops to roughly 26%. All four pairs have a direct 1-hop pool to USDC as the deepest single observed pool—structural proximity, not verified execution paths.
What this may reflect, not verified here: my prior is that this is mostly an inventory problem, not a user-denomination problem. A market maker can hold and rebalance USDC inventory more easily than SGD- or EUR-stablecoin inventory, so the marginal DEX pool forms around USDC even when the token’s denomination is local. A second, weaker hypothesis is user demand: traders may simply prefer dollar exit liquidity. The dataset cannot distinguish those routes. Testing them would require rolling TVL snapshots, observed swap routes, CEX depth, or market-maker flow data.
A broader conjecture sits outside this dataset. Local-currency stablecoins may not be primarily about adopting crypto’s decentralization thesis. They may be about keeping a local unit of account present on a new settlement rail. That would fit the pattern here: the accounting surface can be compliant and inspectable while the open DEX surface remains thin and USDC-centered. But this article does not test issuer motive, policy intent, capital-control design, or contract-level control functions. Those would need a separate governance and legal-structure audit.
3. USDC as comparison point
In the canonical window (2026-05-13 → 05-20), USDC Ethereum processed ~8.5B USDC gross mint/burn volume against a −202M net delta—42× gross-to-net. USDC Base: ~954M gross, −76M net, 13×. USDC price stayed near par throughout.
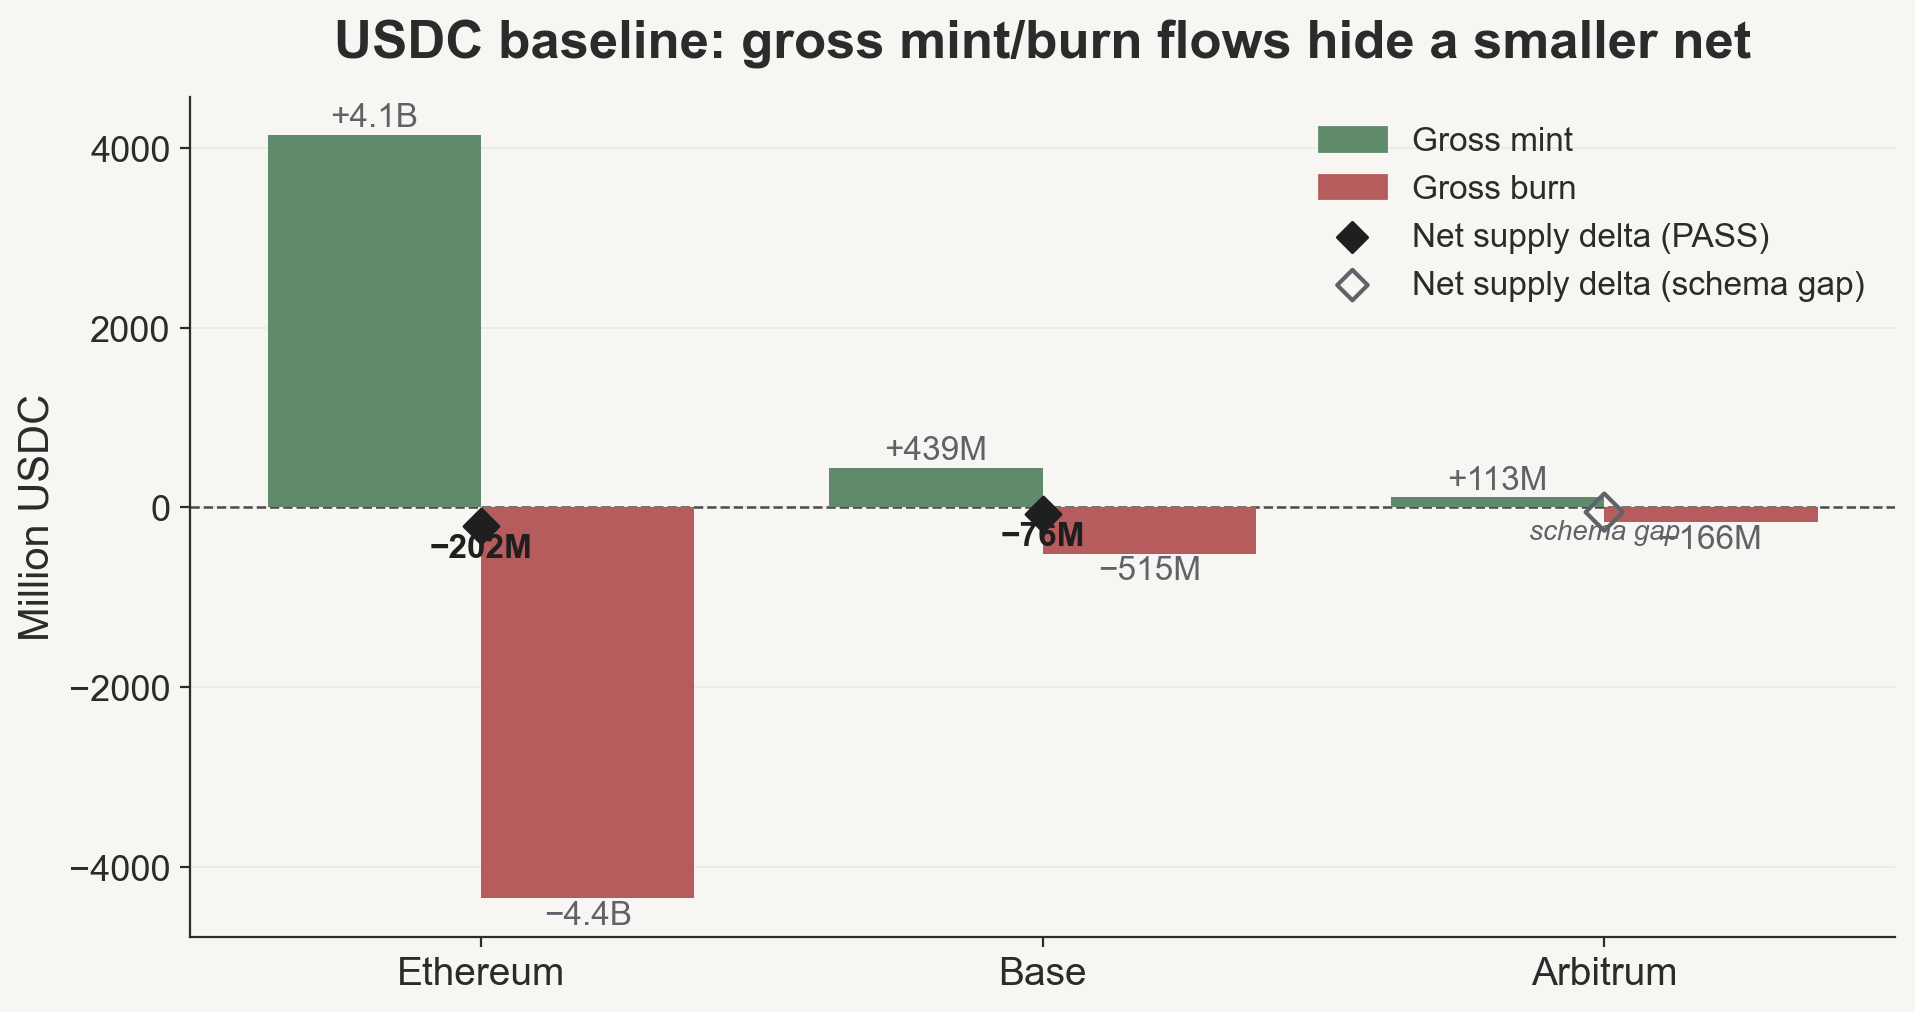
totalSupply delta (+20.6M); the Transfer-event-derived net is not used as the primary figure because the zero-address schema does not capture bridge gateway mints on that chain.
This is the comparison point: large gross flows, modest net footprint, and a zero-address accounting schema that works cleanly on most deployments. USDC Arbitrum remains a bridge/gateway schema gap.
4. Same schema, different surface thickness
The accounting surface differs by roughly four orders of magnitude across these seven pairs.
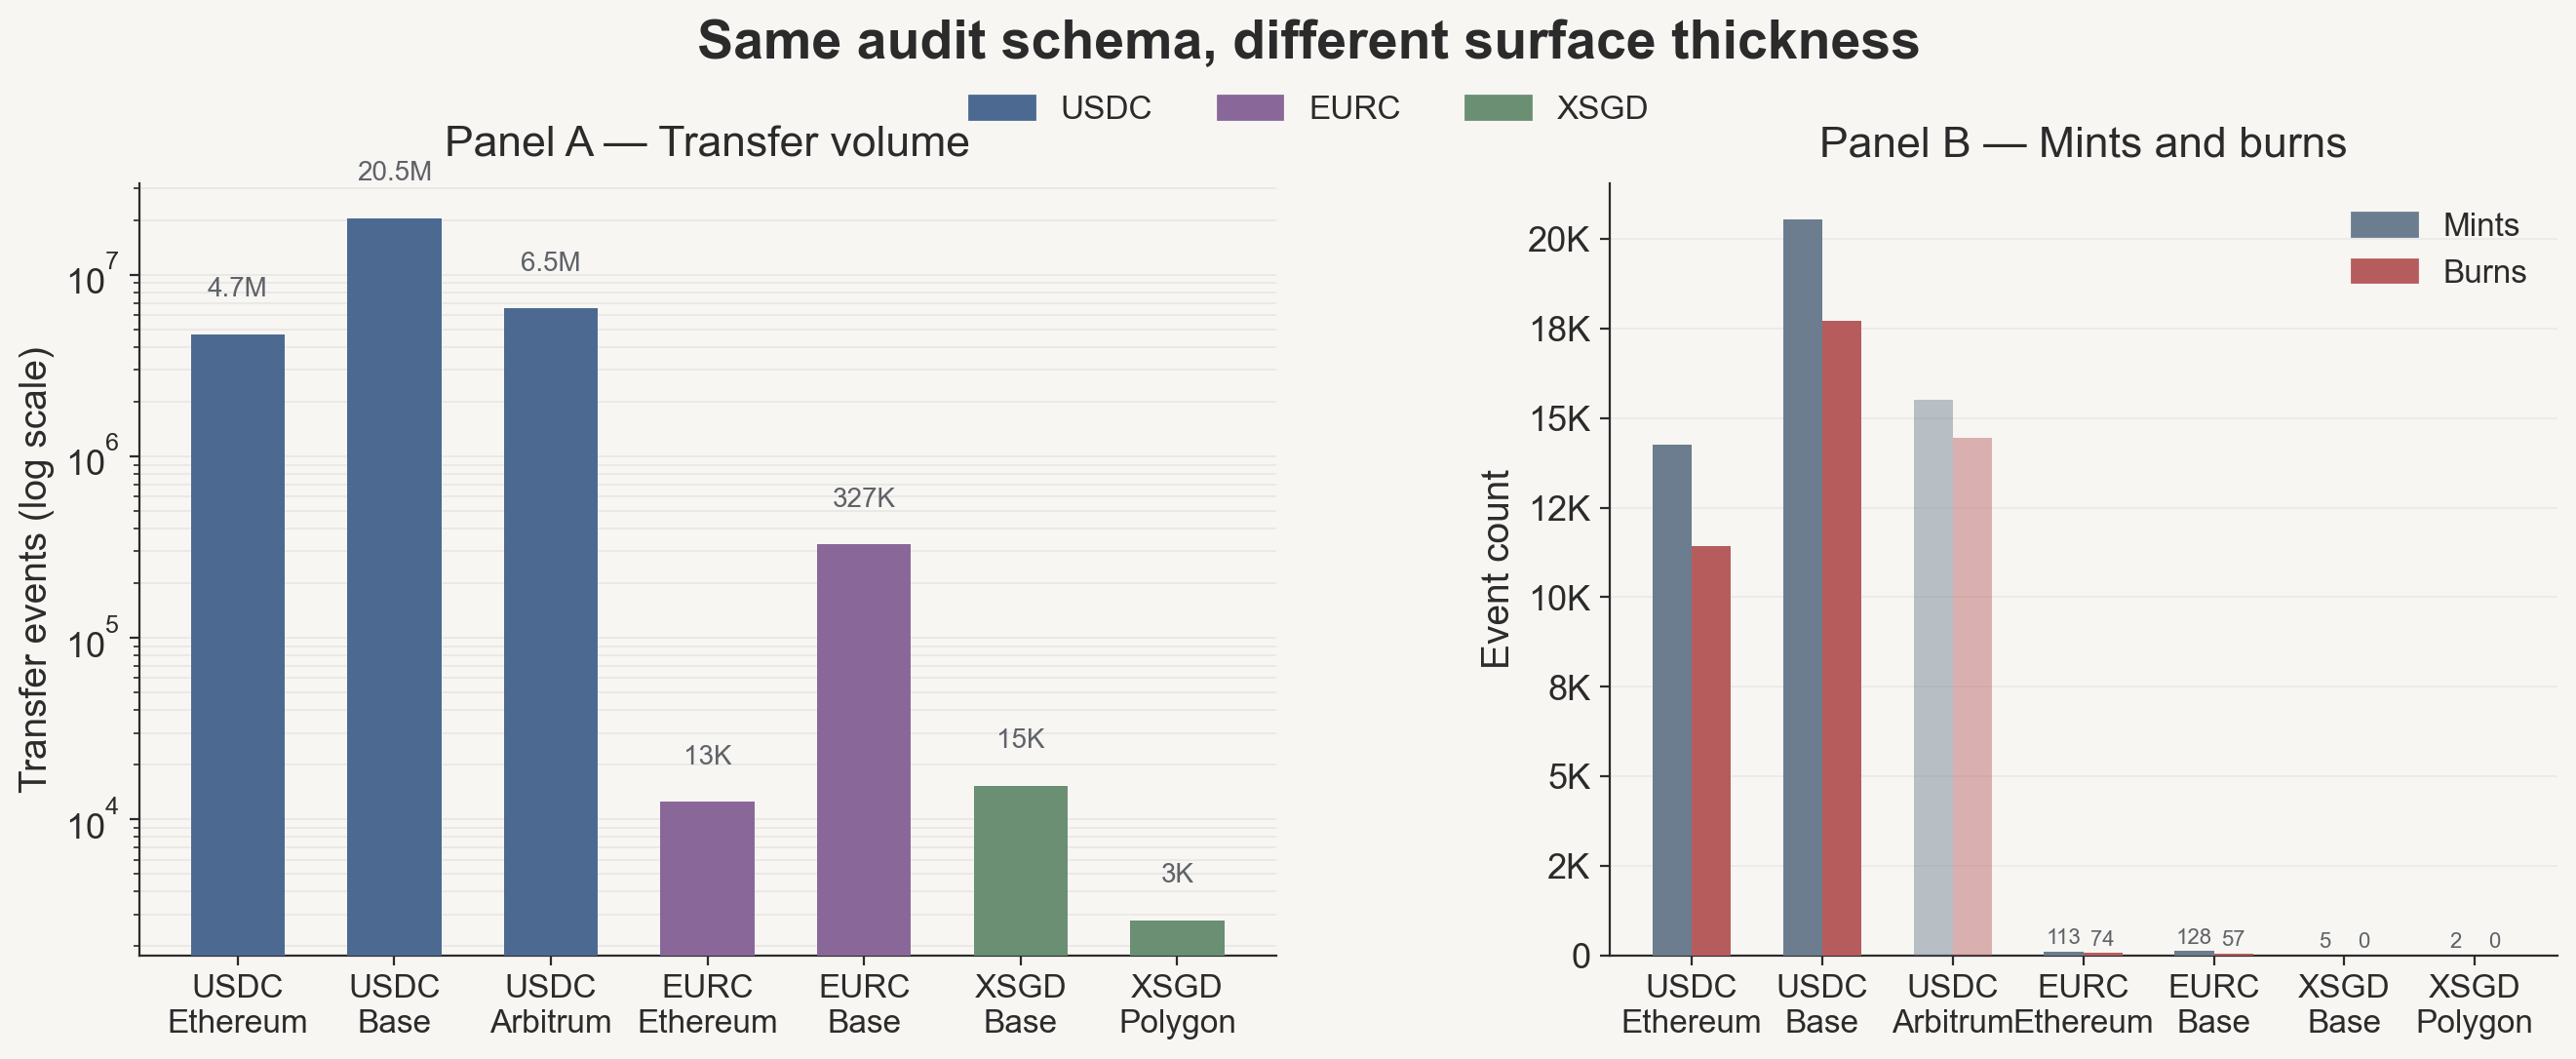
USDC Base: 20.5M Transfer events. XSGD Polygon: 2,784. EURC Ethereum: 12,519. The 4,000× gap is why log scale is necessary—and why a thin surface is not evidence of low real-world usage. It is evidence of a narrower on-chain accounting trail to audit. XSGD and EURC may clear substantial activity through intermediaries, CEXs, or OTC rails not visible in ERC-20 Transfer logs.
Two patterns in the data:
XSGD zero burns. Both XSGD chains show zero burn events in the window, so the zero-address event view captures mint-side expansion but not a two-sided redemption cycle. This should not be interpreted as full issuer-side flow (XSGD Base supply audit; XSGD Polygon supply audit).
EURC Ethereum elevated gross-to-net. EURC Ethereum has a 56× gross-to-net ratio on 12,519 transfers, meaning a small number of large mint/burn events dominate gross activity. This audit does not identify the counterparties or business process behind those events (EURC Ethereum supply audit).
Conclusion
The narrow result is that visible XSGD and EURC DEX liquidity is materially organized around USDC—not an adoption ranking, a reserve claim, or a peg comparison. The DEX snapshot does not capture CEX depth, OTC desks, issuer redemption flows, or actual swap paths, so the finding is bounded to the observed on-chain liquidity surface.
The next thing to measure is not another price chart. It is rolling pair-dependence: as XSGD and EURC evolve, does USDC share decline, or does dollar-rail concentration persist? This panel is one data point; the time series is the test.
Appendix: evidence trail
Canonical window: 2026-05-13T00:00:00Z → 2026-05-20T00:00:00Z. Data and reproduction files are in the stablecoin-audit repo. Key artifacts:
- Canonical window audit panel — transfer counts, mint/burn, gross-to-net ratio, invariant status for all seven asset-chain pairs
- Pair-dependence summary — observed DEX pool TVL by counterpart class
- Full claim-to-artifact map — C1–C20 evidence mapping with source CSVs and quality grades