The Yen Broke. What Actually Moved Onchain?
First came risk transfer. Then exposure grew—mostly among traders already there.
Markets Are Full of Roads argued that visible routes are not migration. Did the Commodity Shock Reach the Tokenized Market? asked whether a commodity shock even registered in tokenized marks. This yen case separates the next rungs: turnover, risk transfer, gross exposure, and funding path.
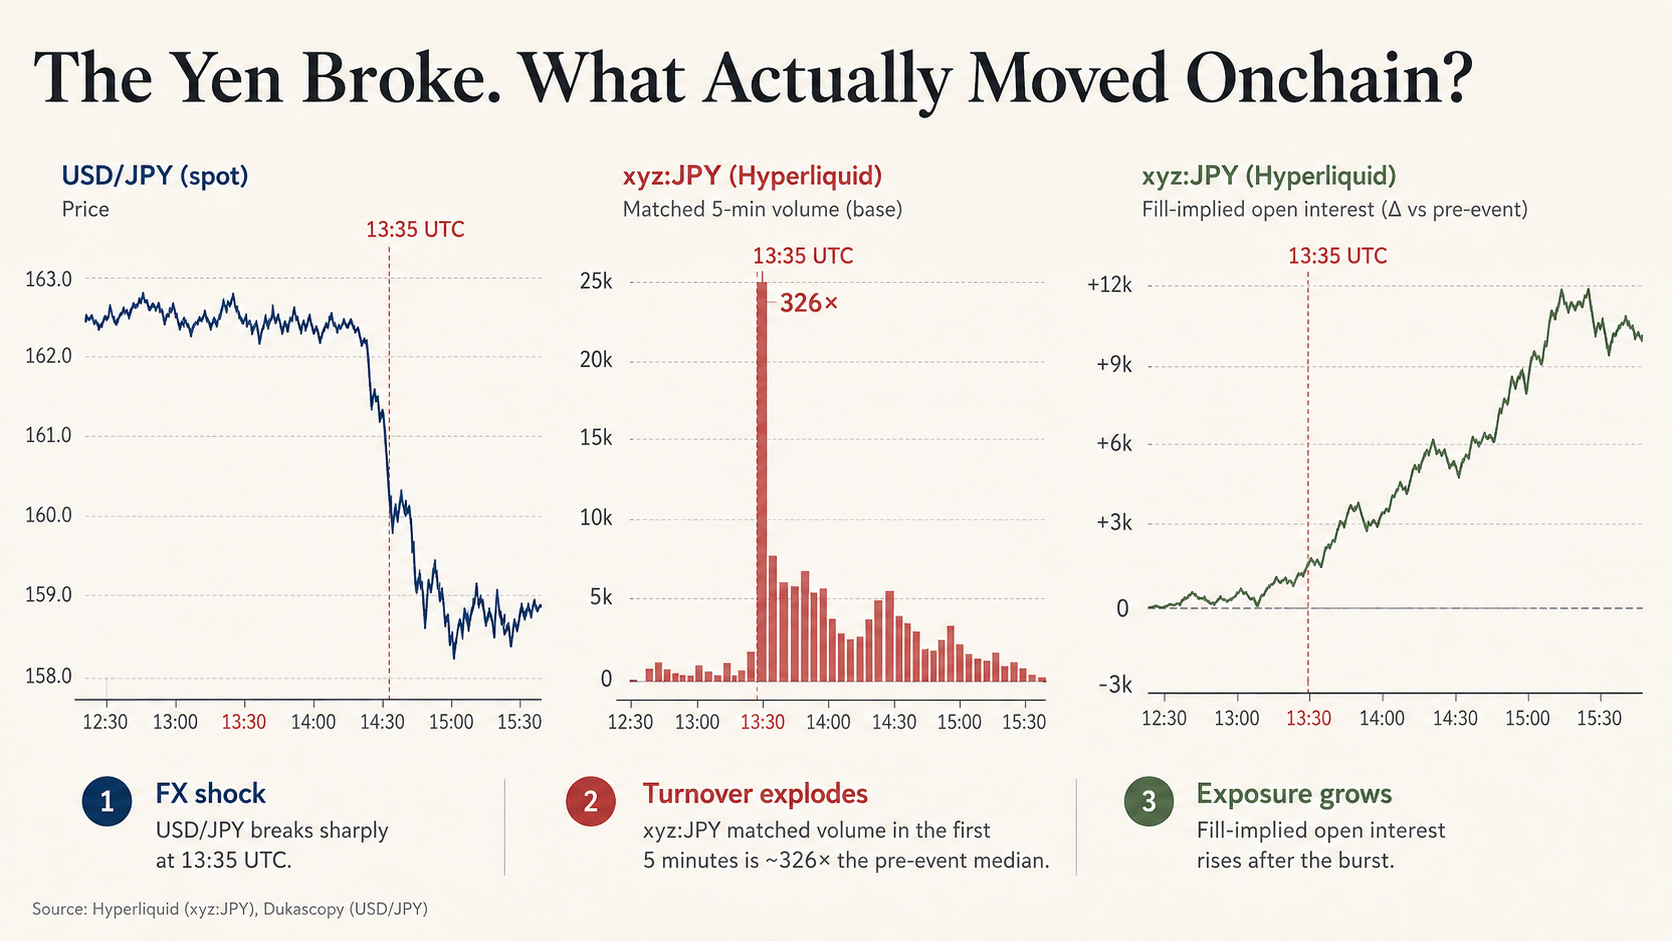
On 30 July 2026, at 13:35 UTC, USD/JPY broke hard. Large yen reversals revive a familiar fear: carry under stress, risk assets next, and—if you watch crypto—another round of contagion. The question here is narrower. What, exactly, showed up onchain when the print hit?
One market did not stay quiet. Hyperliquid lists a yen perpetual, xyz:JPY, under HIP-3 isolated margin. In the five minutes beginning at the shock, matched volume was 24,228.19 base and 1,087 trades—about 326× the frozen immediate pre-event median for that market. Price moved with the spot FX window. The tape woke up.
I am not claiming Hyperliquid discovered the FX move ahead of the cash market, or that its oracle import is irrelevant. For what follows, it is enough that an onchain yen book was live, continuous, and extreme in the same window as the spot shock.
The obvious question is whether capital rushed into that book. The answer was more interesting than yes or no.
What 326× Actually Contained
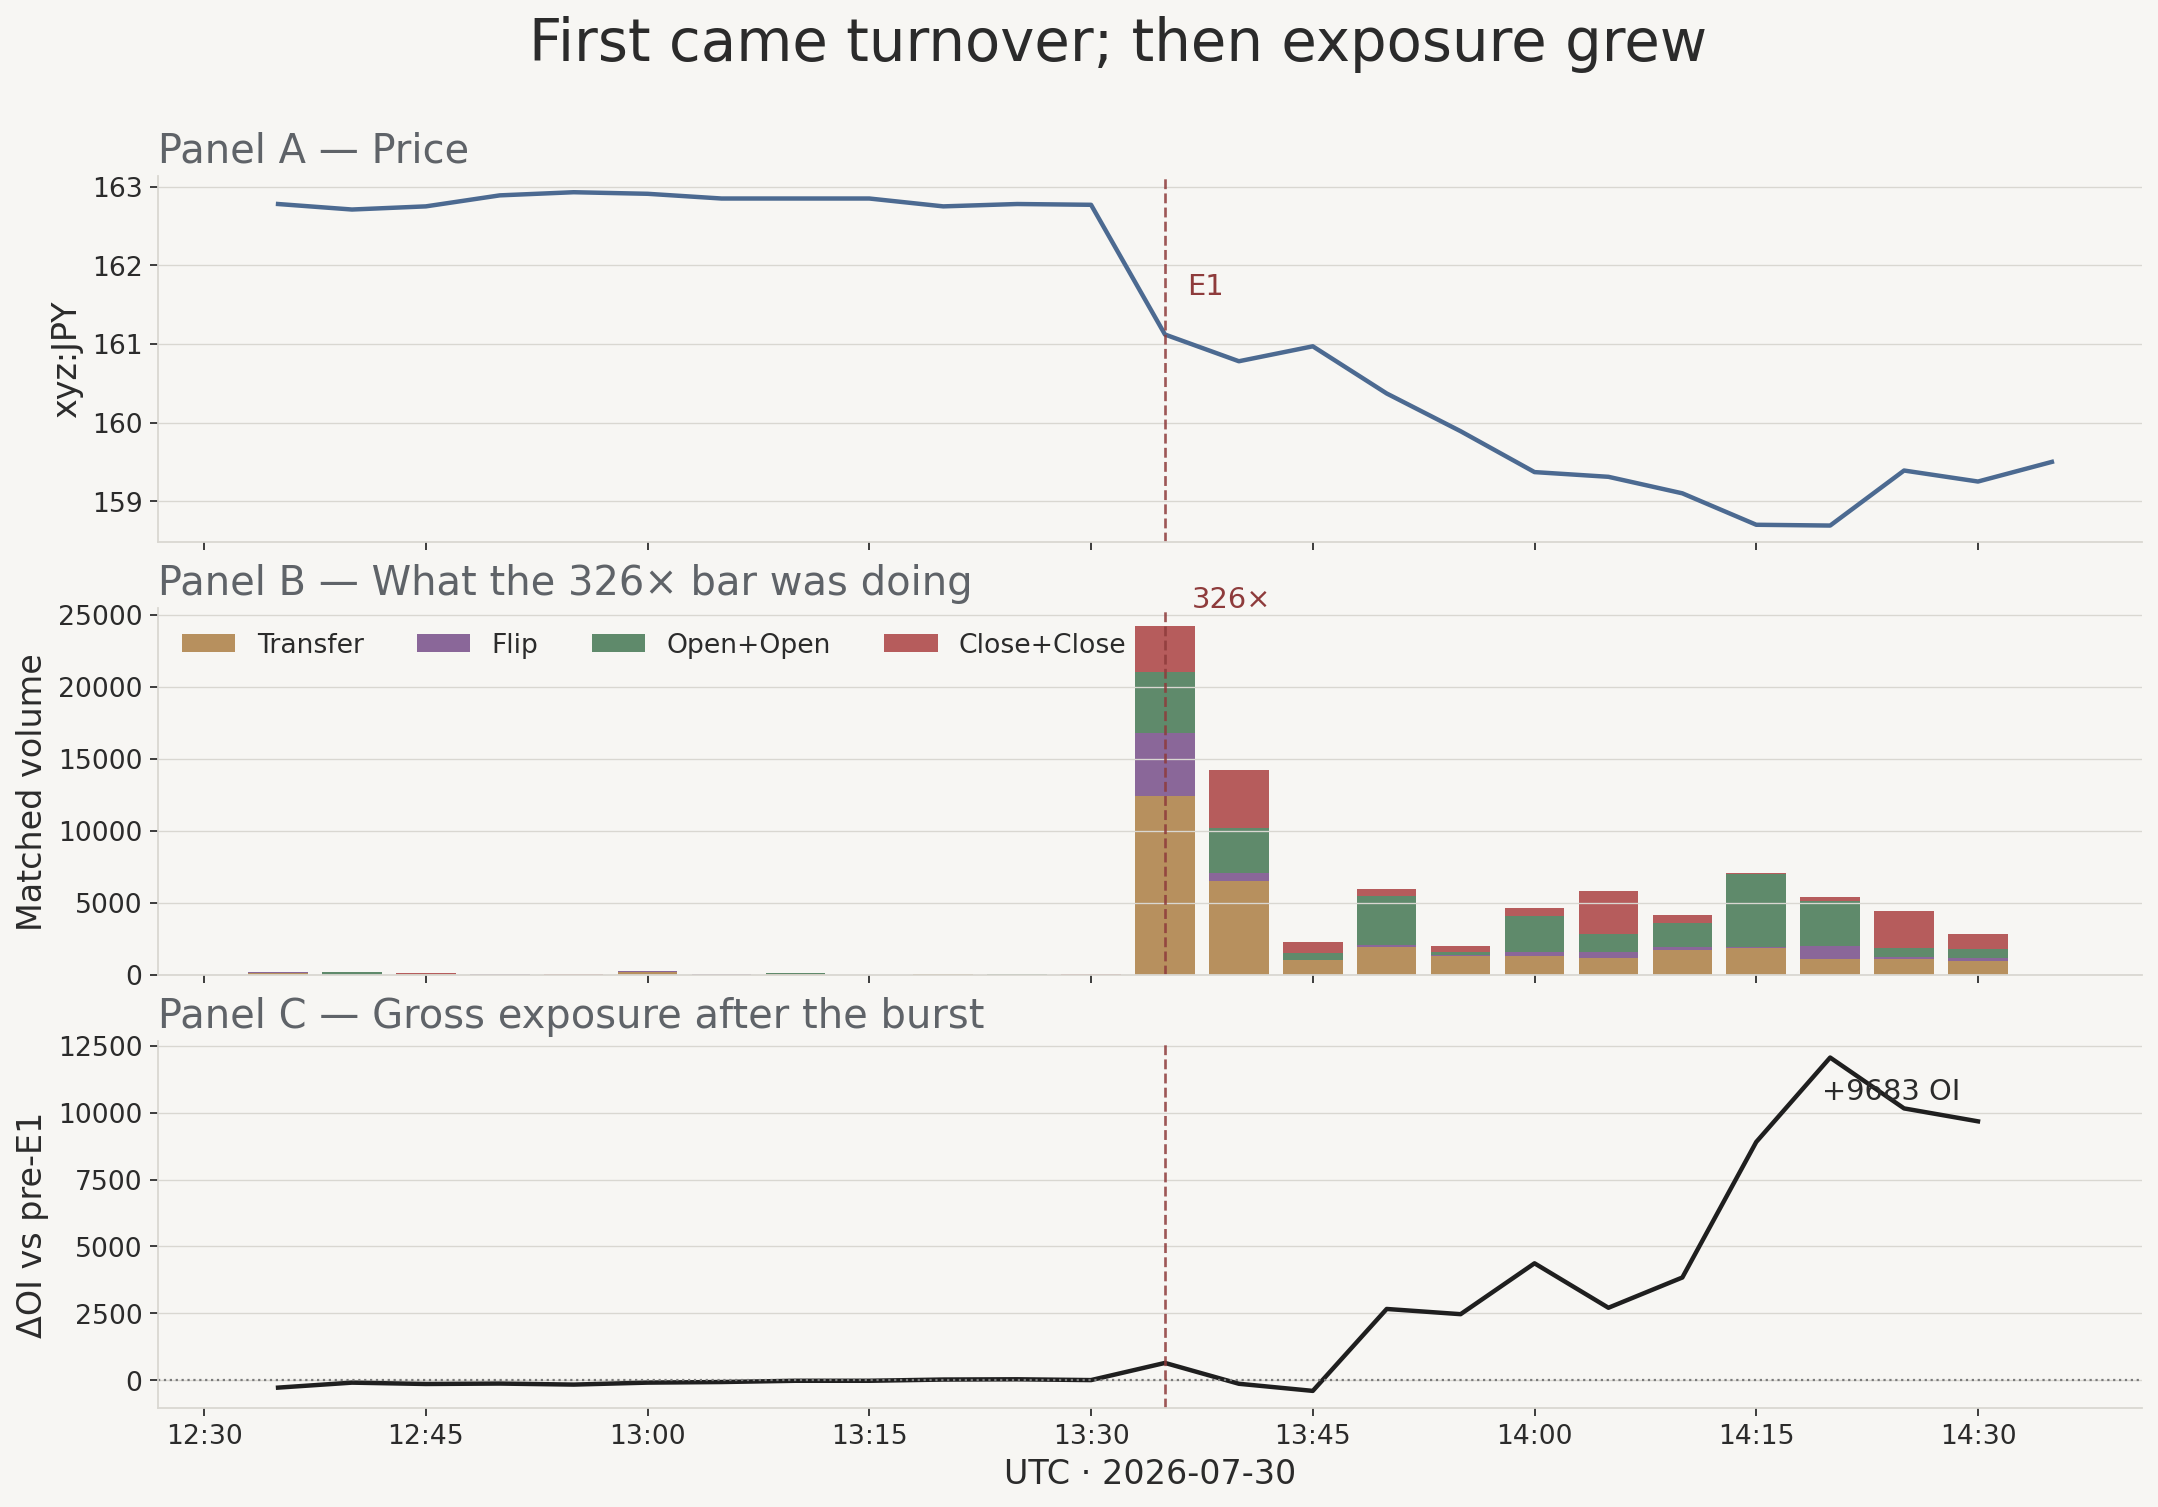
xyz:JPY, matched 5-minute volume rose about 326× versus the frozen pre-event median. Panel B decomposes matched volume by trade class without double-counting counterparties; the event bar is mostly transfer. Panel C shows fill-implied open interest versus the pre-E1 level. Activity and exposure on one venue—not a claim that capital migrated between markets.
Panel A is the price response. Panel B is the activity spike. Panel C is what happened to gross exposure after the burst.
The event bar was not mostly fresh opening. Classifying each matched trade without double-counting counterparties:
| Class | Share of E1 matched volume |
|---|---|
| Transfer (Open + Close) | 51.2% |
| Flip involved | 18.1% |
| Open + Open | 17.5% |
| Close + Close | 13.2% |
More than half of the 326× bar was risk transfer: one side opening while the other closed. Pure simultaneous opening was only 17.5%. That is the first correction to the headline. Extraordinary turnover can be people handing risk to each other, not a stampede of new inventory.
Then Panel C refuses to let the story stop there. Fill-implied open interest—reconstructed from fills and reconciled to the same candle volume and trade count—did not stay flat after the transfer-heavy bar:
| Horizon | OI change (base) |
|---|---|
| +5m | +643 |
| +30m | +4,370 |
| +60m | +9,683 |
| +3h | +7,519 |
| +6h | +12,825 |
So the sequence is not “activity exploded, therefore capital arrived.” It is closer to:
- price moved;
- the first violent minutes were mostly transfer;
- gross exposure expanded afterward.
Transfer and exposure are different objects. The first bar can be dominated by risk changing hands; later bars can still build inventory. The +5-minute open-interest change is already positive (+643), but the larger build arrives later. The event bar tells you how the market cleared the first shock. The cumulative open-interest path tells you how much risk the book was willing to carry once clearing started.
Two caveats sit next to those numbers. They are fill-implied changes relative to the pre-event level, not a vendor’s absolute open-interest snapshots. And they are inventory accounting, not proof that fresh collateral entered the venue.
One architectural constraint matters before anyone says “money moved across markets.” xyz:JPY is isolated / noCross. That does not prove nothing can be funded into the book. It does mean you cannot treat a Hyperliquid BTC or ETH fill as automatic collateral for a yen perp. Cross-market stories need their own evidence.
July 30 crossed turnover and exposure. Whether it crossed migration requires a funding path—not another volume multiple.
Who Took the New JPY Risk?
If open interest rose, who added it?
Among accounts with positive fill-implied open-interest contribution through six hours after the shock, about 76% of that positive attribution came from traders already active in xyz:JPY before the event. About 22% came from accounts with no BTC/ETH activity in the ±6h tape—an observational residual, not proof of new wallets or fresh capital. About 2% came from existing Hyperliquid traders who were new to xyz. The top ten accounts accounted for roughly 58% of the positive additions. Concentration is real; a single-whale monopoly is not required to explain the path.
A shock does not have to recruit a new population. Incumbents can scale. If the people adding risk were already in the book, the adjustment can be local to that market’s existing risk-bearing capacity. You do not get to infer a venue-wide capital relocation from the open-interest path alone.
Was the exposure funded by traders shrinking BTC or ETH positions into yen? The candidate pattern—BTC/ETH down, xyz up—shows up, but only as about 3–5% of positive xyz open-interest attribution. That is a small reallocation candidate set, not a migration story.
Was there an explicit inbound funding path into the isolated book? Yes, a thin one. We observed 33 send events with destinationDex=xyz, across 6 accounts, totaling about US$215k. Timing often looked tight: several of those sends were followed by xyz trading within thirty minutes. Aggregate impact on the +6h open-interest change: on the order of 0.02%. There were zero perpDexClassTransfer events in the reconstructed ledger window.
An observable funding path can exist and still fail to explain the exposure response. Most of the inventory change is not sitting on that pipe. The few funded accounts are useful because they show what a real funding trail looks like when it appears—and how little of the aggregate OI change it covers here.
What we can say cleanly:
- new gross risk-bearing in
xyz:JPYafter the shock is supported; - most of the positive attribution sits with incumbents;
- capital migration into the book, as an explanation of the aggregate OI change, is not supported at meaningful scale.
What we cannot say: that “new money flooded the onchain yen market,” or that BTC/ETH inventory funded the yen book at scale.
One Yen Episode, Different Market Questions
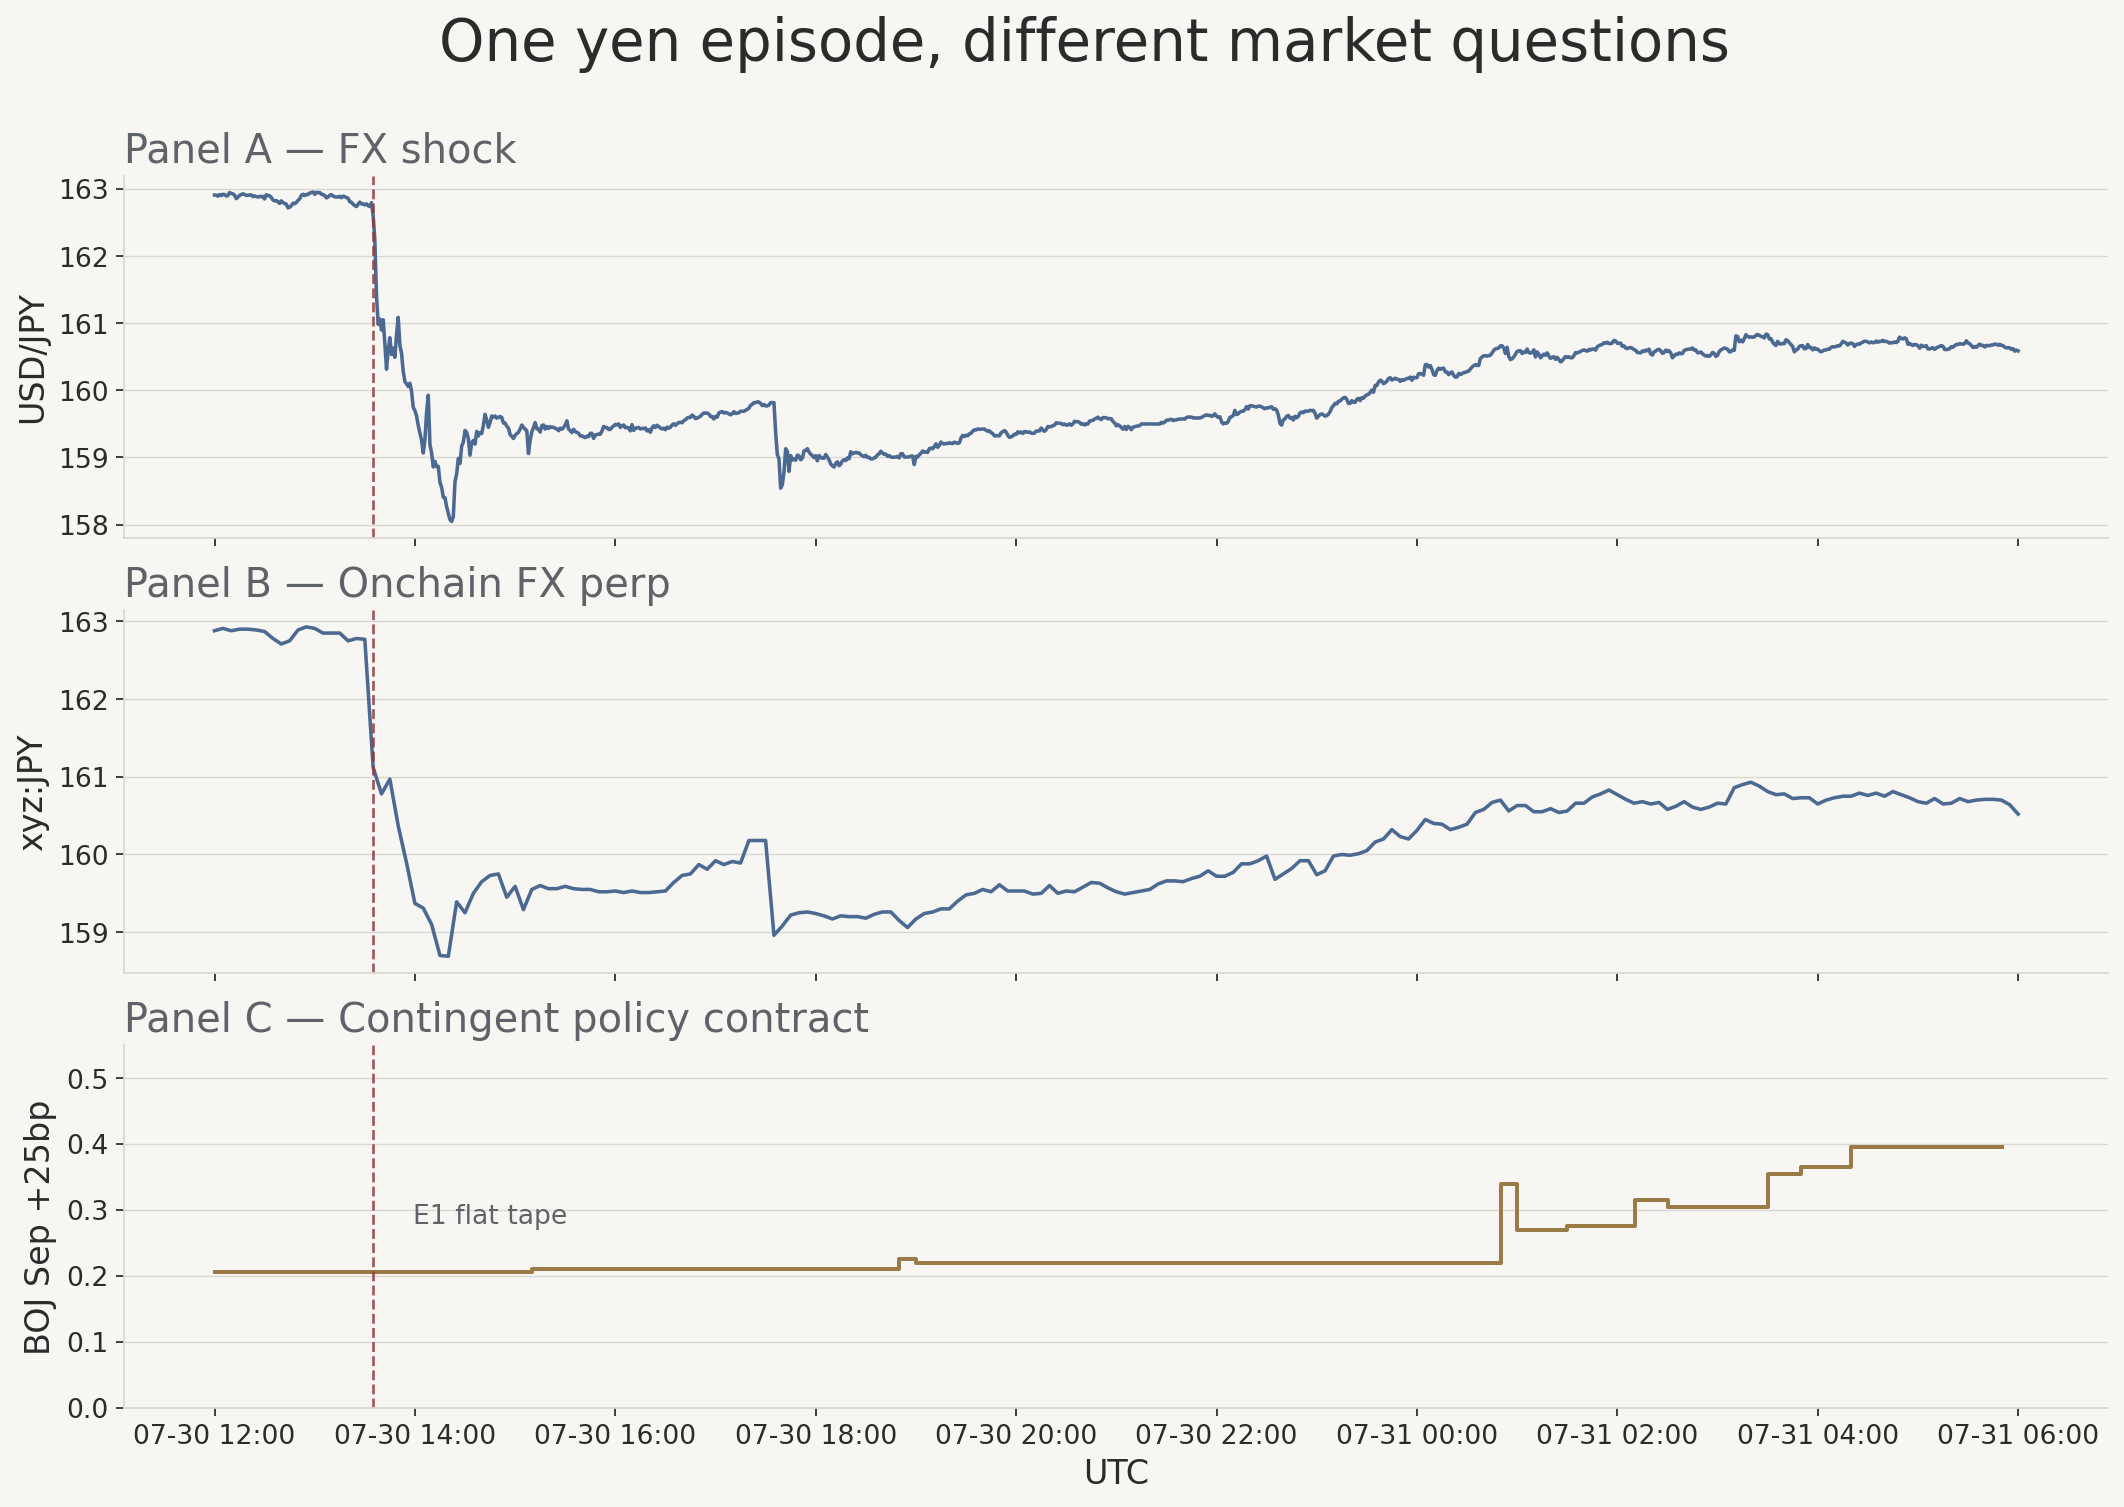
xyz:JPY; Panel C is the Polymarket BOJ September +25 bp contract. E1 flatness on Polymarket coincides with many zero-trade hours and is not read here as active indifference or as a lag claim relative to FX.
The same calendar episode shows up in three places that are easy to mash together and wrong to mash together.
Panel A is spot USD/JPY—the FX state itself.
Panel B is xyz:JPY—an onchain perpetual claim on that FX state, with margin, liquidation, and local inventory.
Panel C is a Polymarket contract on whether the Bank of Japan raises by 25 bp in September—a state-contingent policy claim, not another FX quote.
At the yen-shock hour, the BOJ contract’s recorded probability path sat near 0.205. The cascade-hour trade sample has zero fills, and zero-trade hours were ordinary for this contract—so flatness is not evidence of active indifference, and it is not a lag claim relative to FX. Later, when BOJ-relevant information arrived early on 31 July, the same contract repriced toward roughly 0.40 with observed participation. It can move on its own information. It is not obligated to reprint every USD/JPY tick.
A yen perp and a September hike contract can both be “about Japan” and still answer different questions.
The Yen Moved. Crypto USD Barely Did.
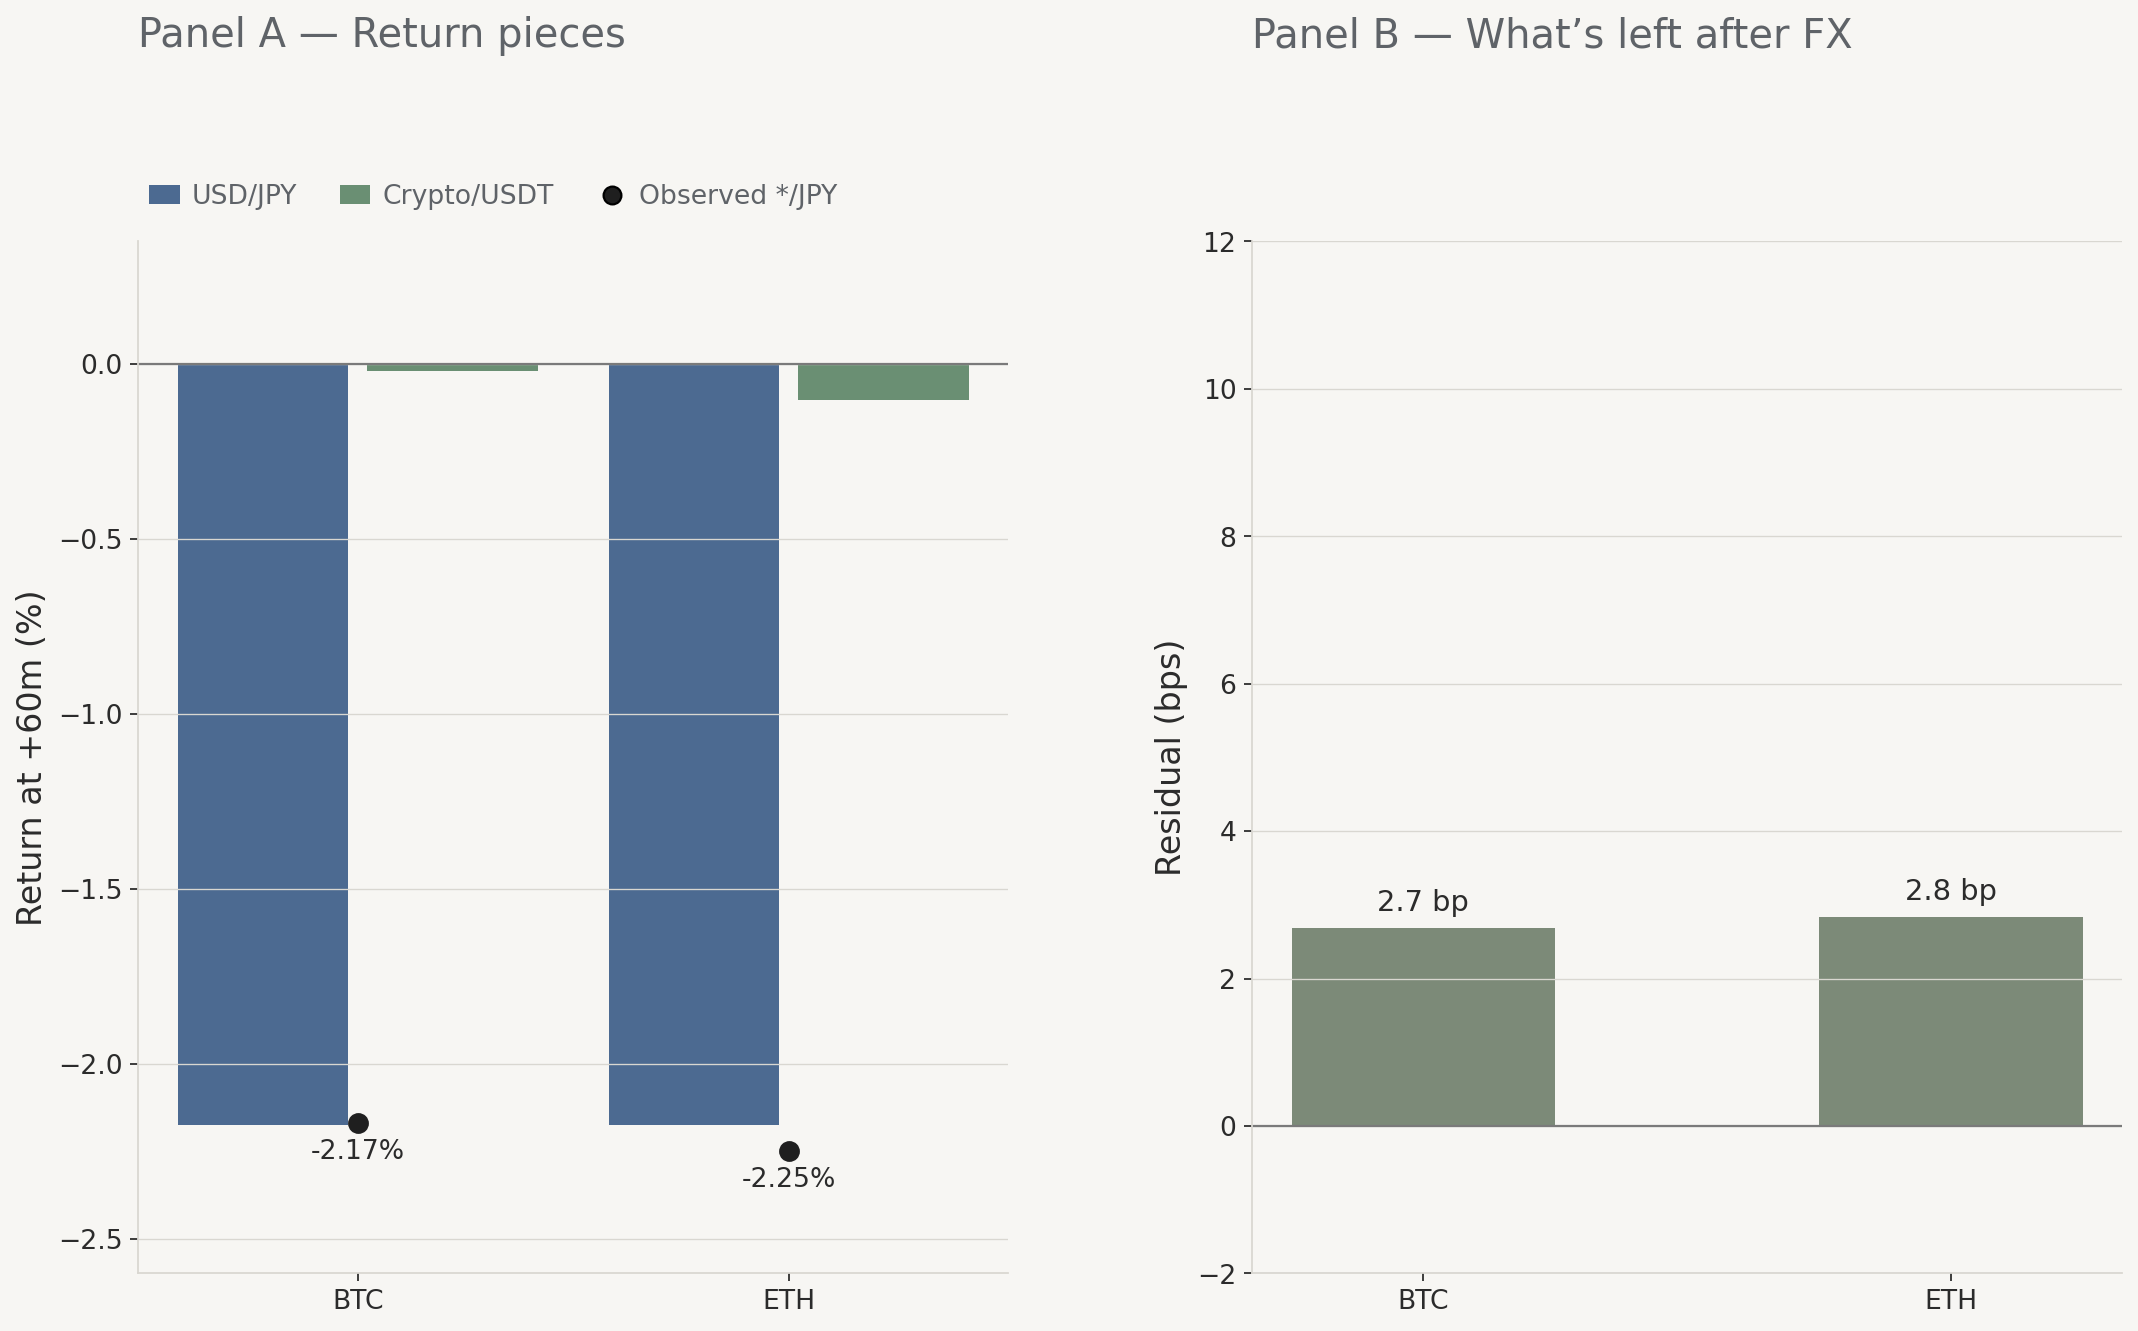
If you only watch crypto priced in yen, the first hour looks like a crypto crash.
At +60 minutes, BTC/JPY and ETH/JPY were down 2.17% and 2.25%. Their USDT legs were almost flat; USD/JPY alone was down 2.20%. The remaining cross-rate residual was roughly three basis points.
The yen moved. Bitcoin barely did—in dollar terms.
That is an accounting result for this window, not a claim that crypto had zero risk at every horizon, and not evidence of a causal transmission channel. USDT is also not identical to USD; the decomposition uses the traded USDT legs we have.
A large move in BTC/JPY can be almost entirely the quote currency. Narrate that print as crypto contagion from a yen shock and you are reading the denominator as the asset. Pair that with the Hyperliquid result and the episode sharpens: one onchain yen book got violently busy and then carried more risk, while dollar crypto prices in the first hour did not restate the FX shock as a crypto crash.
The Cascade That Did Not Happen
A sudden yen reversal is dangerous in theory for a reason. Brunnermeier, Nagel, and Pedersen’s Carry Trades and Currency Crashes is the cleanest short statement of why: funding-currency shocks can force leveraged carry positions to reduce risk, and that deleveraging can spill into other markets. If Hyperliquid’s yen book had been the onchain face of a classic unwind, the things to look for would include shrinking exposure, liquidation-dominated tape, and broader risk-asset selling.
That is not what the Hyperliquid evidence primarily shows. Open interest expanded. Incumbents added exposure. In the first hour, BTC and ETH in USD terms were near baseline, not in freefall. We also lack a liquidation feed in this package, so “no liquidations” is not a claim I can make. The weaker claim is enough: the inventory path does not look like a classic unwind on this venue.
So the carry-crash paper is a relevant competing mechanism—the fear the market brings to a yen shock—not the empirical description of this tape.
Brunnermeier and Pedersen’s Market Liquidity and Funding Liquidity separates a severe local demand for immediacy from a funding-liquidity spiral that becomes common across markets. Map the evidence that way and the first hour looks like intense local immediacy and risk transfer—326× turnover, majority transfer share—followed by new risk-bearing in the yen book, without clear first-hour commonality into crypto USD prices or the U.S. 10-year yield.
At +60 minutes, USD/JPY is extreme. The dollar index also moves materially in the window. BTC and ETH in USD are weak or null. The U.S. 10-year is effectively flat. Gold and Nasdaq futures are tempting to read as “risk” or “haven,” but they sit under a same-day U.S. GDP/PCE release at 12:30 UTC—about sixty-five minutes before the FX shock—so those bars are confounded for transmission ranking.
None of that proves the wider financial system was calm in every channel.
There is a second chain people reach for after yen intervention: not private carry, but official dollar funding. Supporting the yen typically means selling dollars—from cash, from liquidating dollar assets including Treasuries, or from borrowing dollars against those assets. Forced Treasury sales into a constrained dealer market can, in principle, pressure yields and liquidity. Eligible official accounts can also borrow dollars against Treasuries through the Fed’s FIMA repo facility, which offers an alternative to forced sales. Japan’s Ministry of Finance said on August 3 that it plans to use FIMA in the future, making this collateralized dollar-funding channel institutionally concrete without establishing that it drove or materially funded the July 30 episode. The +60-minute 10-year move does not show that stress in this window.
Two competing chains:
- Chain A: yen strengthens → private carry losses → leverage reduction → cross-asset selling.
- Chain B: intervention needs dollars → reserve mobilization → Treasury sale or collateralized dollar funding → possible Treasury-market stress → broader funding conditions.
July 30 stressed the FX market violently. The first-hour evidence we have does not show either chain completing into a system-wide cascade.
Closing
We followed one shock farther than a price chart normally allows: price → turnover → risk transfer → exposure → accounts → attempted funding path. The trail stopped before large-scale capital migration. That is not a failure of the data. It tells you where the adjustment actually occurred: mostly among traders already carrying JPY risk on Hyperliquid, after a transfer-heavy opening burst, with only a trace of explicit inbound funding against a much larger open-interest change.
The yen shock moved USD/JPY hard. The onchain yen perp printed an extraordinary local burst. Gross exposure in that book rose. Incumbents absorbed most of the added risk. Crypto-in-yen looked broken mostly because the yen did. The first-hour global cascade failed to appear in the series we measured.
In the archived FX panel, USD/JPY fell from about 162.8 to a trough near 158.0 within the first hour, then climbed back toward the low-160s by the following morning. A violent defense still left room for the market to test the same boundary again.
What if July 30 was not the start of a crisis, but a stress test of a financial regime that may be becoming harder to defend?
The frozen tape cannot answer that. It can only show that this time, the shock was absorbed before the broader cascade appeared.
How many times can the same system absorb the same kind of shock before the response itself changes?
Appendix — Provenance
- Frozen event: 2026-07-30 13:35 UTC (E1).
- Hyperliquid
xyz:JPY: 5m candles + SQD matched fills (matched volume and trade count reconcile at the event bar). - Fill-implied OI change is reconstructed from fills relative to the pre-event level; it is not a vendor absolute open-interest snapshot.
- Polymarket: BOJ September +25 bp contract probability path and trade sample as archived.
- Numeraire: Binance BTC/ETH JPY & USDT; Dukascopy USD/JPY; +60m residual ~3 bp.
- Cross-asset companions: archived first-hour series; gold/Nasdaq confounded by same-day U.S. GDP/PCE.